Supplier Performance & Receiving
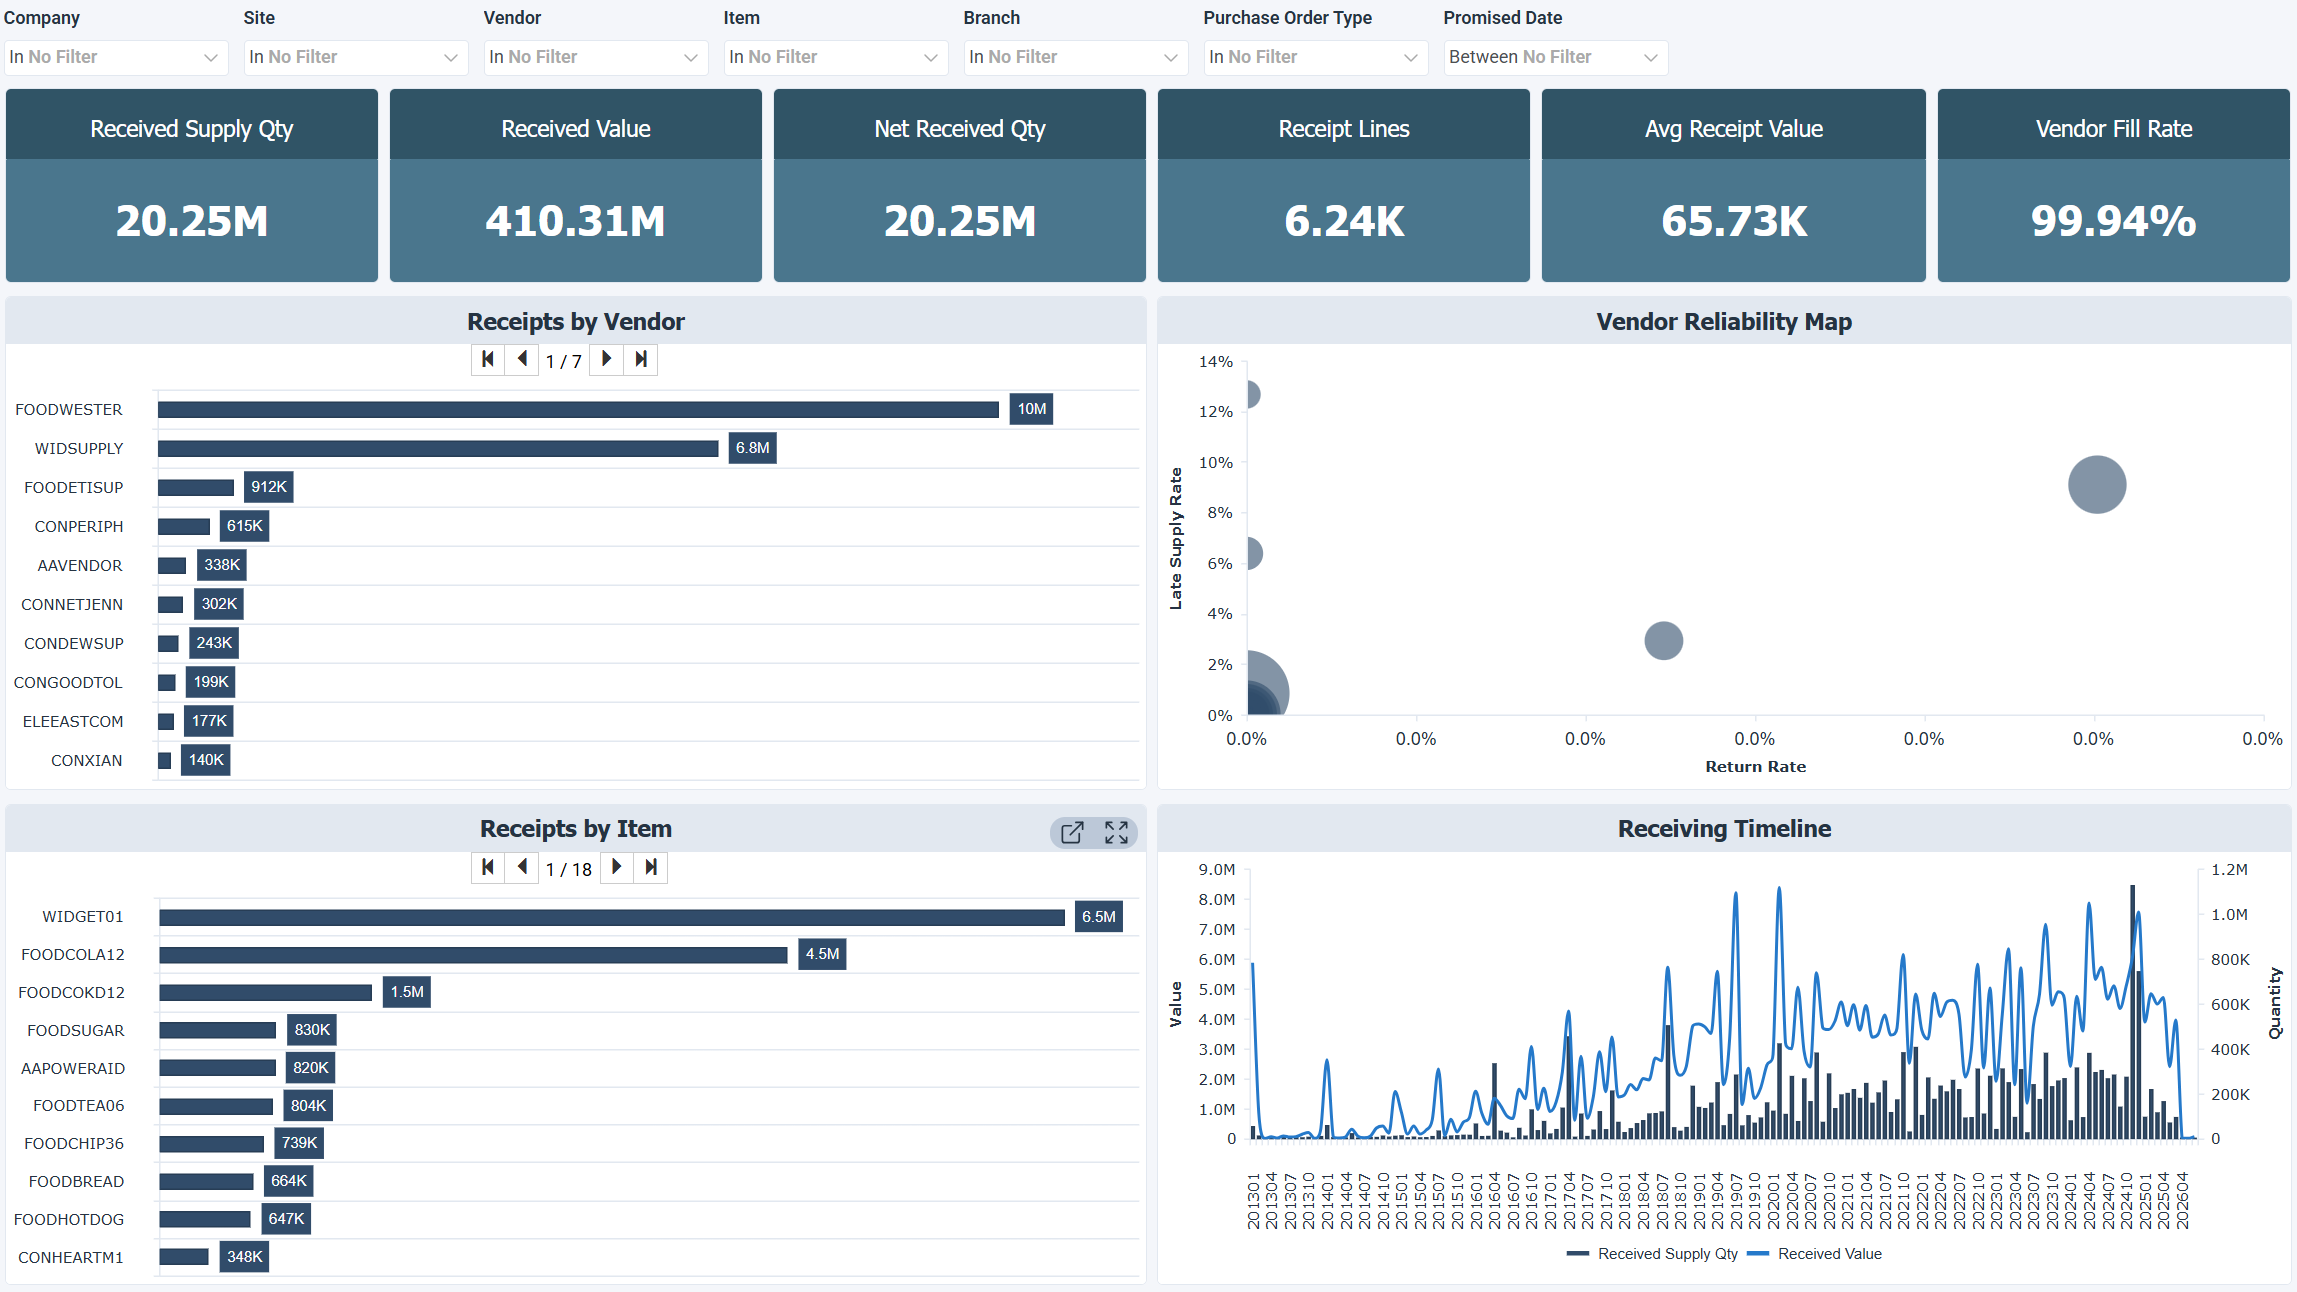
The Supplier Performance & Receiving dashboard for Acumatica monitors received supply, vendor reliability, and receiving activity over time. It looks at how much has been received and at what value, how consistent vendors are in fulfilling orders, and which vendors and items account for the most inbound inventory flow. Use this dashboard to evaluate supplier performance beyond cost alone and inform procurement decisions.
When you review this dashboard, vendors with high received value and low return and late rates are the most reliable. Vendors with high received value but delivery or quality problems carry the highest risk to your supply chain and need a review with procurement. The Receiving Timeline shows whether supply comes in steadily or in irregular spikes that could strain receiving operations.
How to use the supplier performance and receiving dashboard
- Measure total inbound supply by quantity and value across all vendors.
- Evaluate vendor reliability based on fill rate, late supply rate, and return rate.
- Identify your highest value vendors and assess their delivery consistency.
- Spot high volume or high value materials driving the most receiving activity.
- Detect irregular receiving patterns that may indicate supply instability.
Filters
Use the filtering panel at the top of the Supplier Performance & Receiving dashboard to control which data is shown. The filters apply to all views and ensure the dashboard reflects the selections you choose.
Key performance indicators (KPIs)
The key performance indicators (KPIs) at the top of the dashboard show six received supply and vendor reliability measures, and update based on the filters you apply.
| KPI | What it measures |
|---|---|
| Received Supply Qty | Total quantity received from vendors across all active purchase orders. |
| Received Value | Total value of goods received into inventory, which shows the overall inbound inventory flow. |
| Net Received Qty | Received quantity adjusted for returns and corrections, which shows the actual supply. |
| Receipt Lines | Number of individual receiving transactions recorded in the selected period. |
| Avg Receipt Value | Average value per receiving transaction, which shows the scale of individual deliveries. |
| Vendor Fill Rate | Percentage of ordered quantities received, which measures supplier reliability. |
Visual components
| View name | Type of view | What it shows |
|---|---|---|
| Receipts by Vendor | Horizontal Bar | Ranks vendors by total received value to identify top suppliers and assess vendor dependency. |
| Vendor Reliability Map | Bubble | Displays each vendor by return rate (horizontal axis) against late supply rate (vertical axis), with bubble size reflecting received value. Vendors in the top right quadrant combine high lateness and high returns and carry the greatest risk. Vendors in the bottom left with large bubbles are the most reliable suppliers with the highest received value. |
| Receipts by Item | Horizontal Bar | Breaks down received value by item to show the high volume and high value materials behind the most inbound activity. |
| Receiving Timeline | Combination | Tracks received quantity and value over time to show whether supply arrives consistently or in irregular spikes. |