Production Demand & Backlog
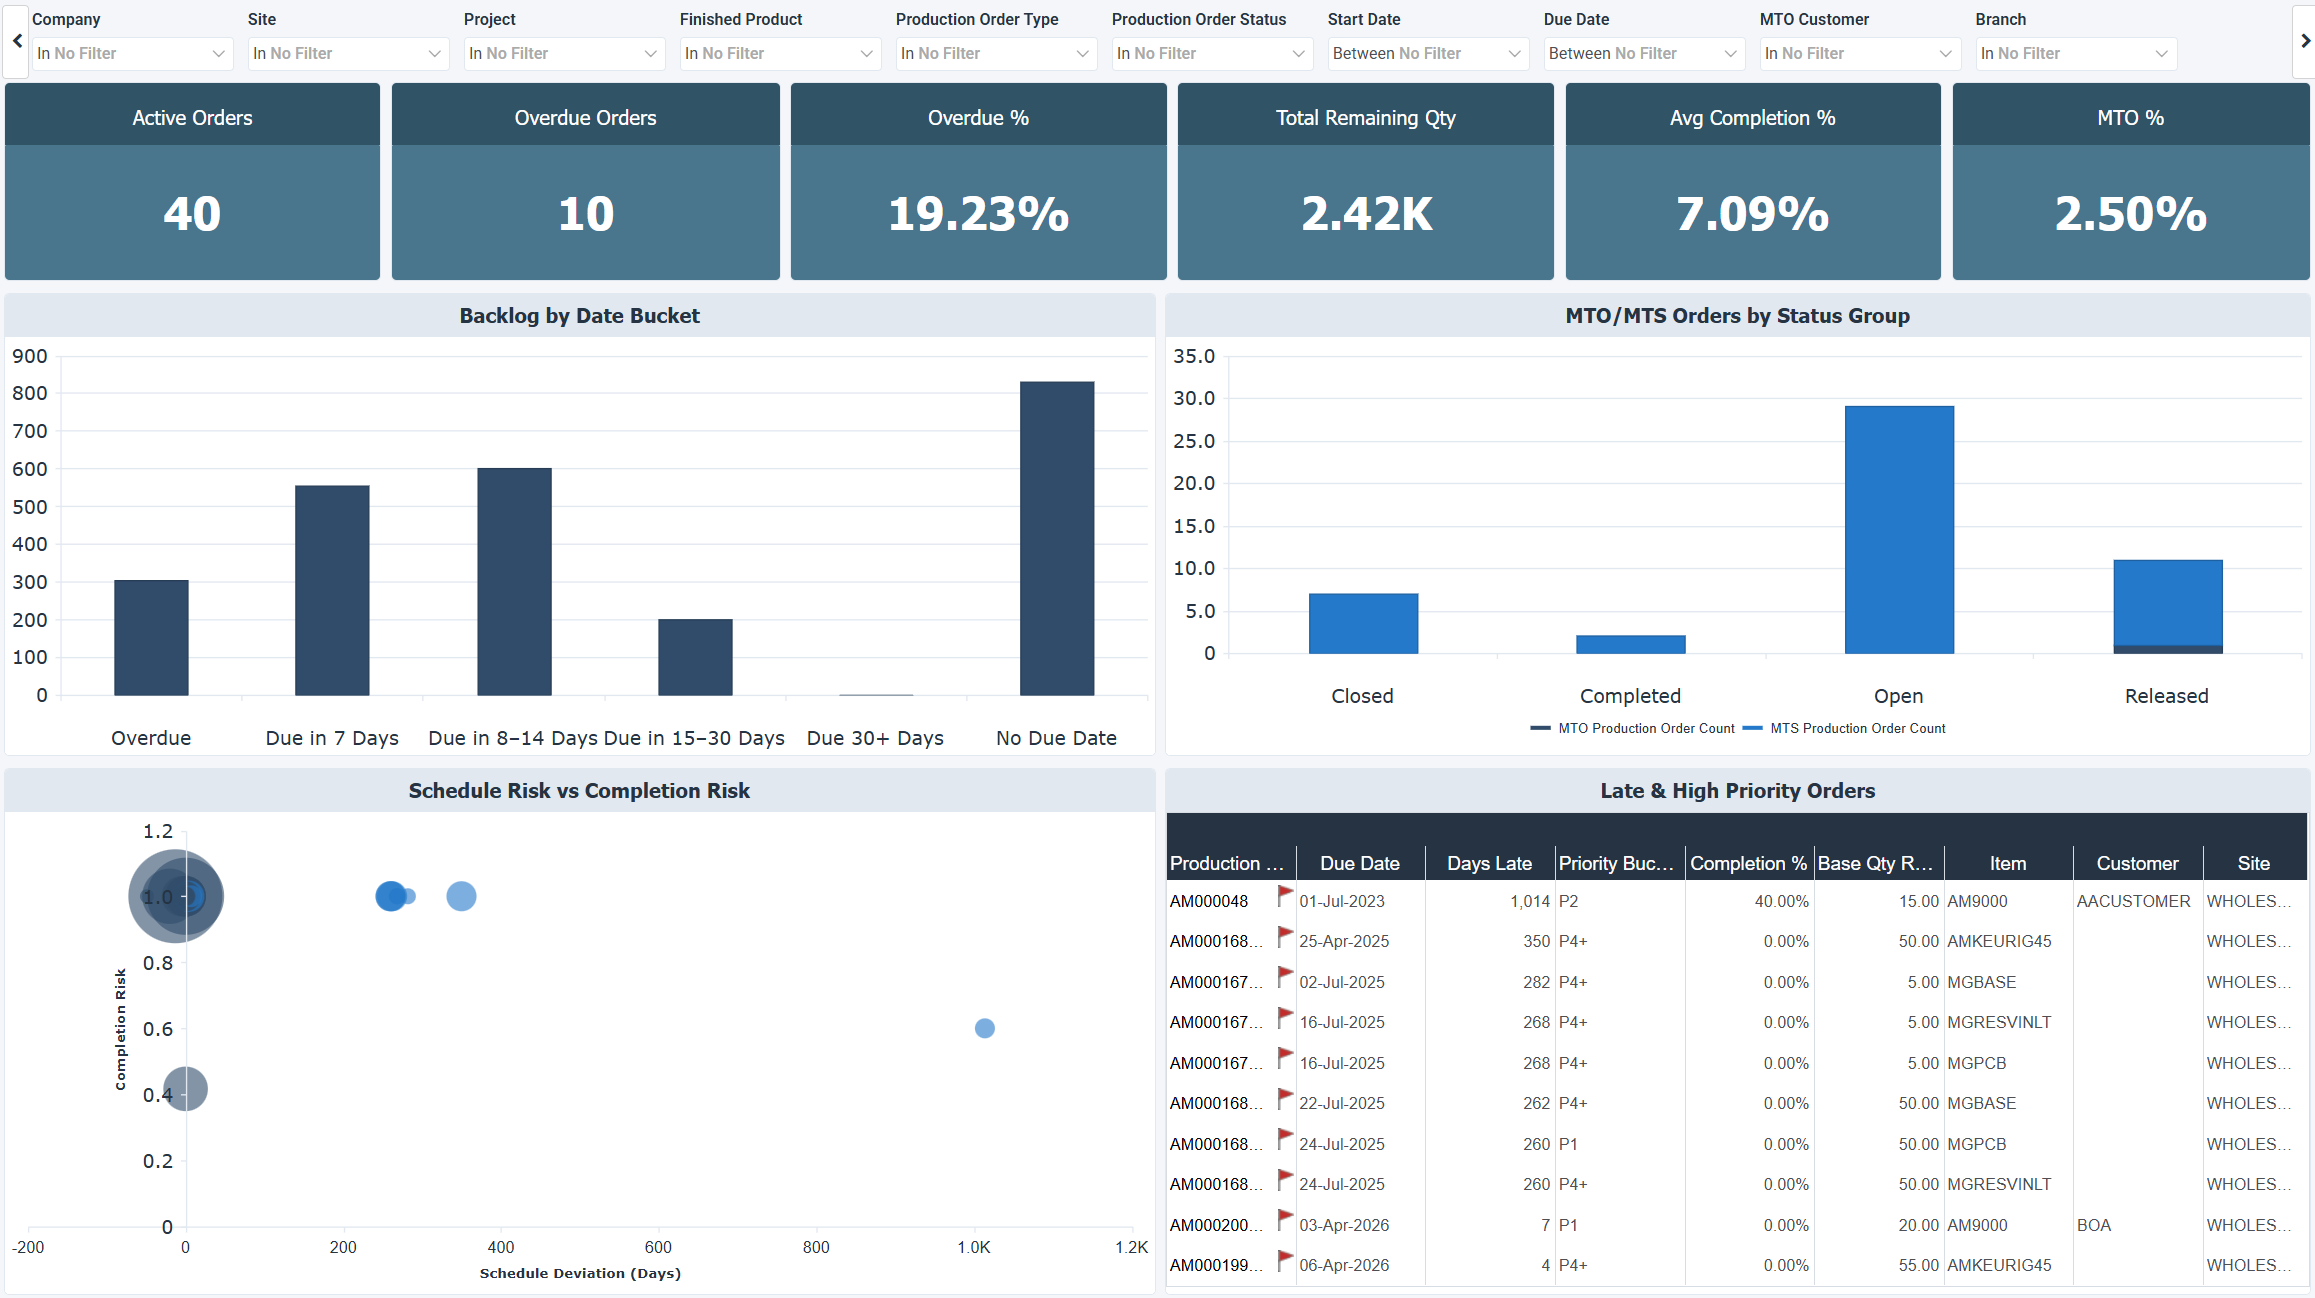
The Production Demand & Backlog dashboard for Acumatica summarizes the current state of the production backlog, including active order volume, overdue orders, remaining quantities, and completion progress. It shows how much work is still outstanding, how urgent that work is, and whether the backlog comes from customer orders or inventory replenishment. Use this dashboard to prioritize the most urgent orders, check how large and how late the backlog is, and match production schedules to demand.
When you review this dashboard, a high Overdue % usually points to a scheduling or capacity issue rather than a single late order. A large share of the backlog with no due date is a planning gap that you can close by assigning due dates before delays start. Orders that are both far past due and barely started come first. Avg Completion % can hide the real picture when many small completed orders sit alongside a few large unfinished ones. A high MTO % means delays reach customers directly and not only inventory levels.
How to use the production demand and backlog dashboard
- Measure the active production backlog by volume, urgency, and remaining work.
- Find overdue orders and orders at risk before delivery dates are missed.
- Separate MTO and MTS orders to see which delays reach customers.
- Spot planning gaps such as orders with no due date, which can cause execution issues later.
- Pinpoint the highest risk orders using schedule deviation and completion progress together.
Filters
Use the filtering panel at the top of the dashboard to control which data is shown. The filters apply to all views and ensure the dashboard reflects the selections you choose.
Key performance indicators (KPIs)
The key performance indicators (KPIs) at the top of the dashboard show six production backlog measures and update based on the filters you apply.
| KPI | What it measures |
|---|---|
| Active Orders | Total number of open production orders currently in the system. |
| Overdue Orders | Number of active production orders that have passed their due date. |
| Overdue % | Percentage of active orders that are past due. Higher values point to scheduling or execution issues. |
| Total Remaining Qty | Total quantity still to be produced across all active orders, which shows the current workload on production capacity. |
| Avg Completion % | Average progress across all active production orders. Read this value alongside the order count and size distribution. |
| MTO % | Percentage of production tied directly to customer orders. Higher values mean delays are more likely to affect customers directly. |
Visual components
| View name | Type of view | What it shows |
|---|---|---|
| Backlog by Date Bucket | Vertical Bar | Groups active production orders by urgency: Overdue, Due in 7 Days, Due in 8-14 Days, Due in 15-30 Days, Due in 30+ Days, and No Due Date. Highlights where the most urgent work is concentrated and exposes planning gaps. |
| MTO/MTS Orders by Status Group | Stacked Bar | Splits Make to Order (MTO) and Make to Stock (MTS) orders by status group to show the mix of production strategies and where orders stand in the workflow. |
| Schedule Risk vs Completion Risk | Bubble | Plots each production order by schedule deviation (X-axis) against completion % (Y-axis), with bubble size reflecting remaining quantity. Orders in the top-right area are both significantly late and incomplete, representing the highest operational risk. |
| Late & High Priority Orders | Worksheet | Lists the most critical orders with days late, priority bucket, completion %, and remaining quantity. Use this list as the starting point for daily production decisions. |