Supply Pipeline & Risk
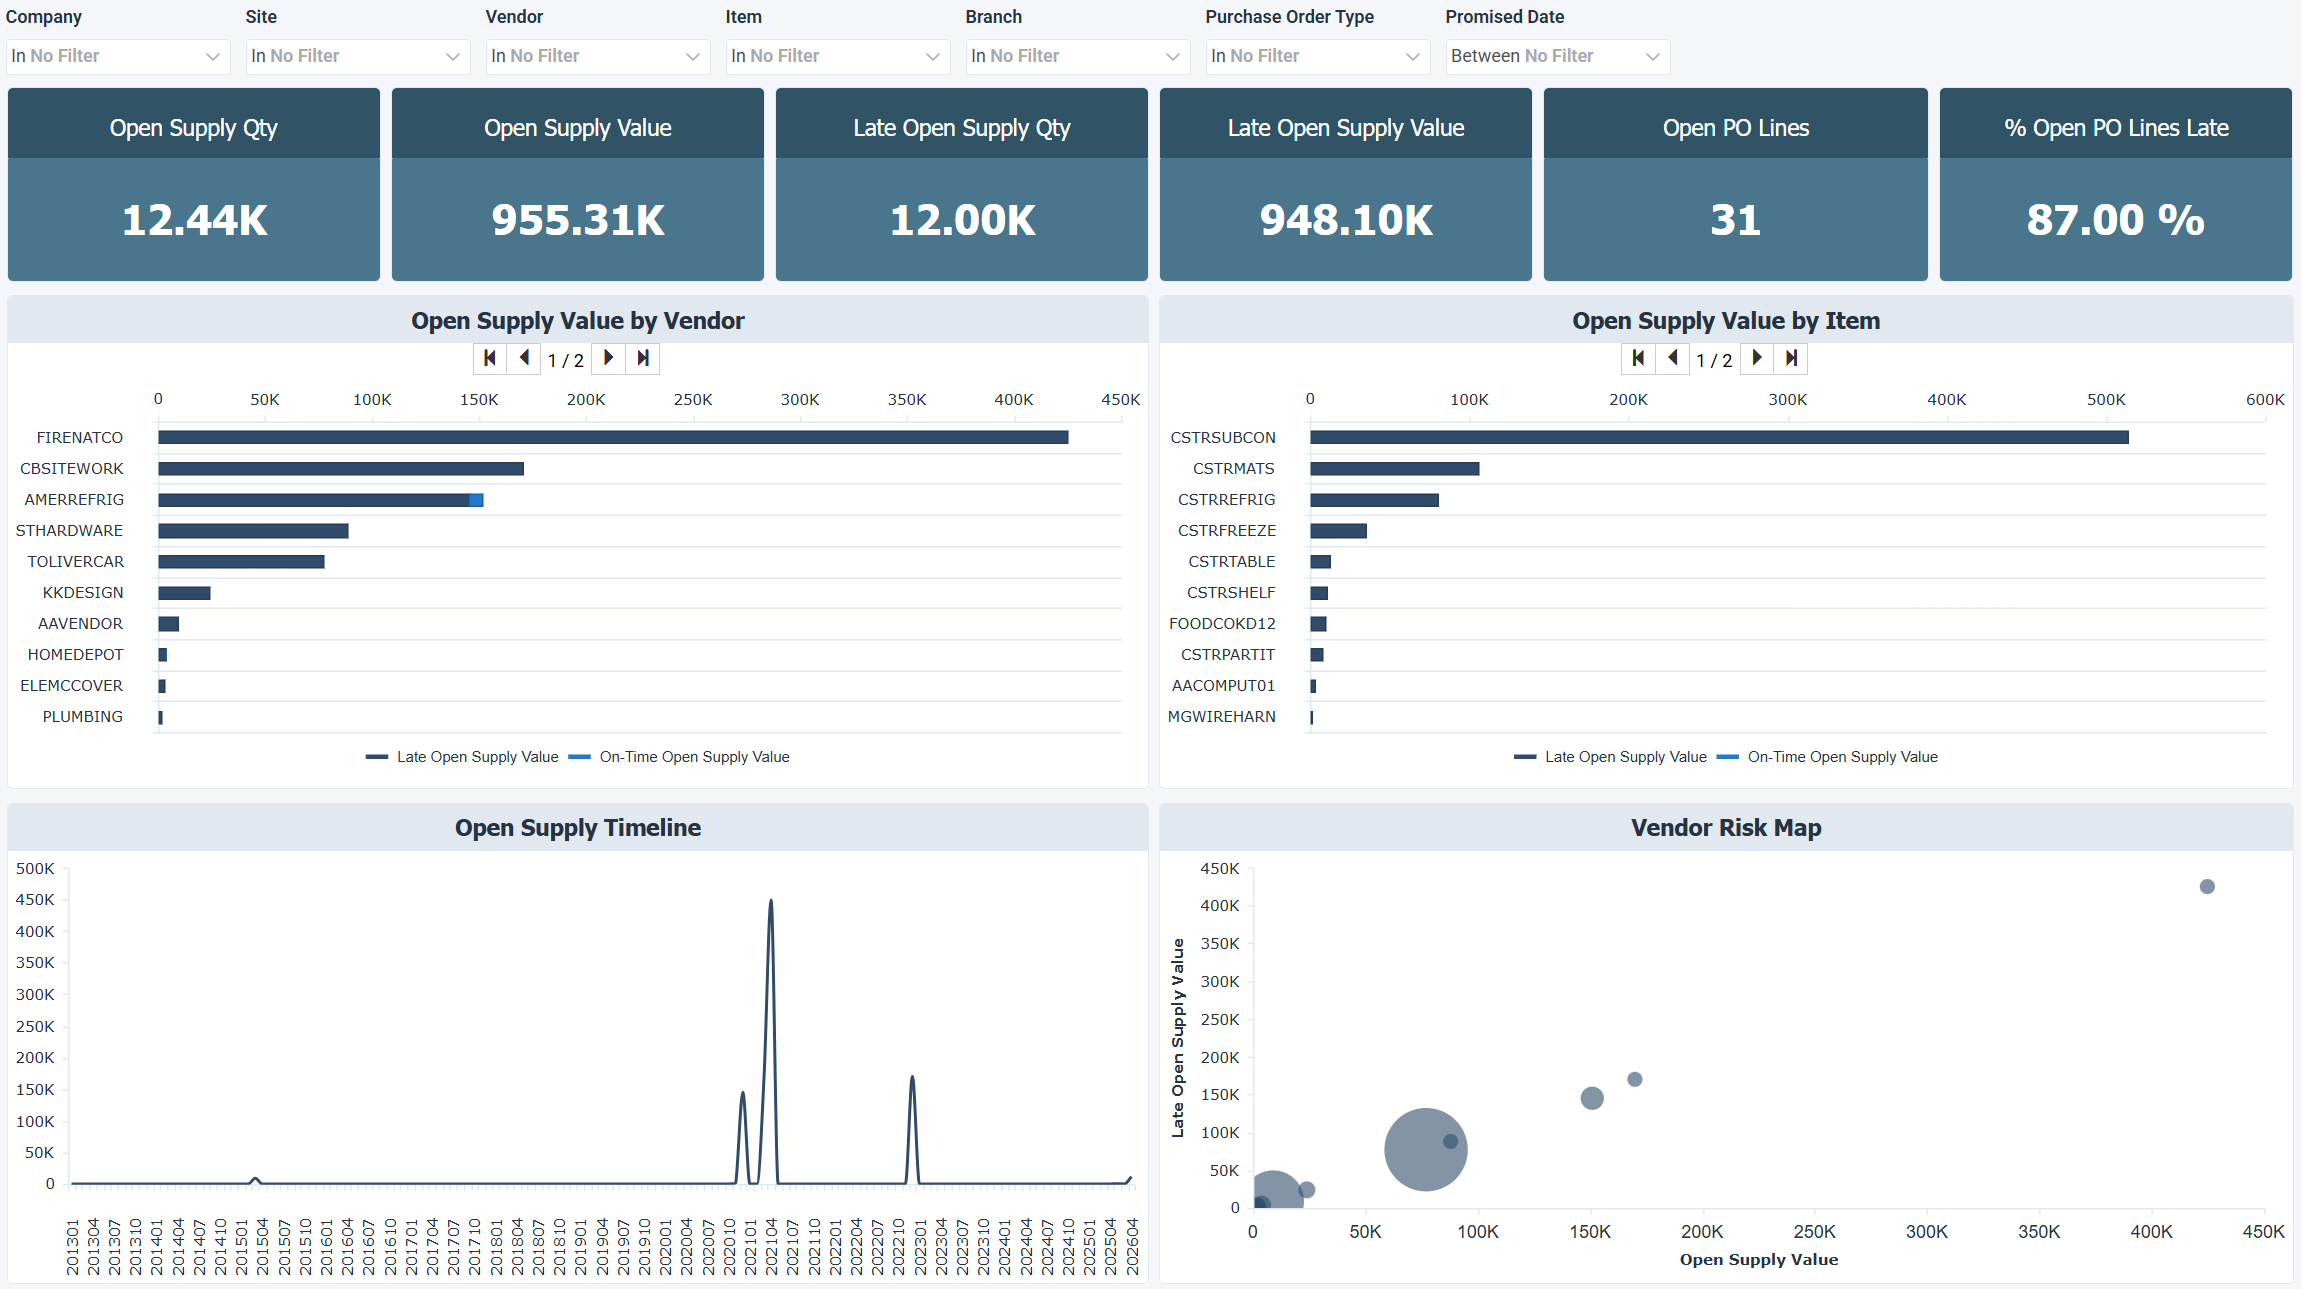
The Supply Pipeline & Risk dashboard for Acumatica follows open purchase orders, vendor delays, and supply concentration risks. It includes what supply is expected and when, how much of it is already late, and which vendors or items carry the highest exposure to your production plan. Use this dashboard to prioritize vendor follow-up, assess supply chain risk, and act before delays reach the shop floor.
When you review this dashboard, a high % Open PO Lines Late is often the first sign that supply chain disruptions are already underway. Vendors with both high open supply value and significant late quantities need immediate follow-up, since they combine financial exposure with delivery risk. The Open Supply Timeline can show uneven supply flow that may create production bottlenecks later, even before orders become formally overdue.
How to use the supply pipeline and risk dashboard
- Quantify total supply exposure by volume and value across all open purchase orders.
- Identify late supply and measure its financial and operational impact.
- Pinpoint high risk vendors based on the combination of supply value and delivery performance.
- Spot supply gaps and spikes in the incoming supply timeline before they affect production.
- Focus procurement actions on the vendors and items that matter most.
Filters
Use the filtering panel at the top of the Supply Pipeline & Risk dashboard to control which data is shown. The filters apply to all views and ensure the dashboard reflects the selections you choose.
Key performance indicators (KPIs)
The key performance indicators (KPIs) at the top of the dashboard show six open supply and late supply measures, and update based on the filters you apply.
| KPI | What it measures |
|---|---|
| Open Supply Qty | Total quantity expected from open purchase orders, which shows the overall volume of incoming supply. |
| Open Supply Value | Total value of expected incoming supply, which shows the financial exposure tied to open vendor commitments. |
| Late Open Supply Qty | Quantity of supply that has passed its promised date, which quantifies the operational impact of delays. |
| Late Open Supply Value | Total value of supply not received by the promised date, which shows the size of the supply chain disruption. |
| Open PO Lines | Number of active purchase order lines currently outstanding. |
| % Open PO Lines Late | Percentage of purchase order lines that are currently past due, which measures overall supplier reliability. |
Visual components
| View name | Type of view | What it shows |
|---|---|---|
| Open Supply Value by Vendor | Stacked Bar | Ranks vendors by total supply value, split between late supply and supply that arrives on time, to identify vendors with a high dependency and those contributing most to delays. |
| Open Supply Value by Item | Stacked Bar | Breaks down open supply value by item, split between late supply and supply that arrives on time, to point out critical materials and high value supply dependencies. |
| Open Supply Timeline | Spline | Follows the value of expected incoming supply over time to show supply spikes and gaps that could create production bottlenecks. |
| Vendor Risk Map | Bubble | Compares each vendor by open supply value (horizontal axis) against late open supply value (vertical axis), with bubble size reflecting supply quantity. Vendors in the top right quadrant combine high value and high lateness and come first in priority. The further right and higher up a vendor sits, the greater the risk. |