Production Output & Throughput
The Production Output & Throughput dashboard for Acumatica reports production completions, output value, and the flow of finished goods into inventory. It follows how much is produced and at what value, which products contribute the most volume and revenue, and whether completed production is recorded in inventory on time.
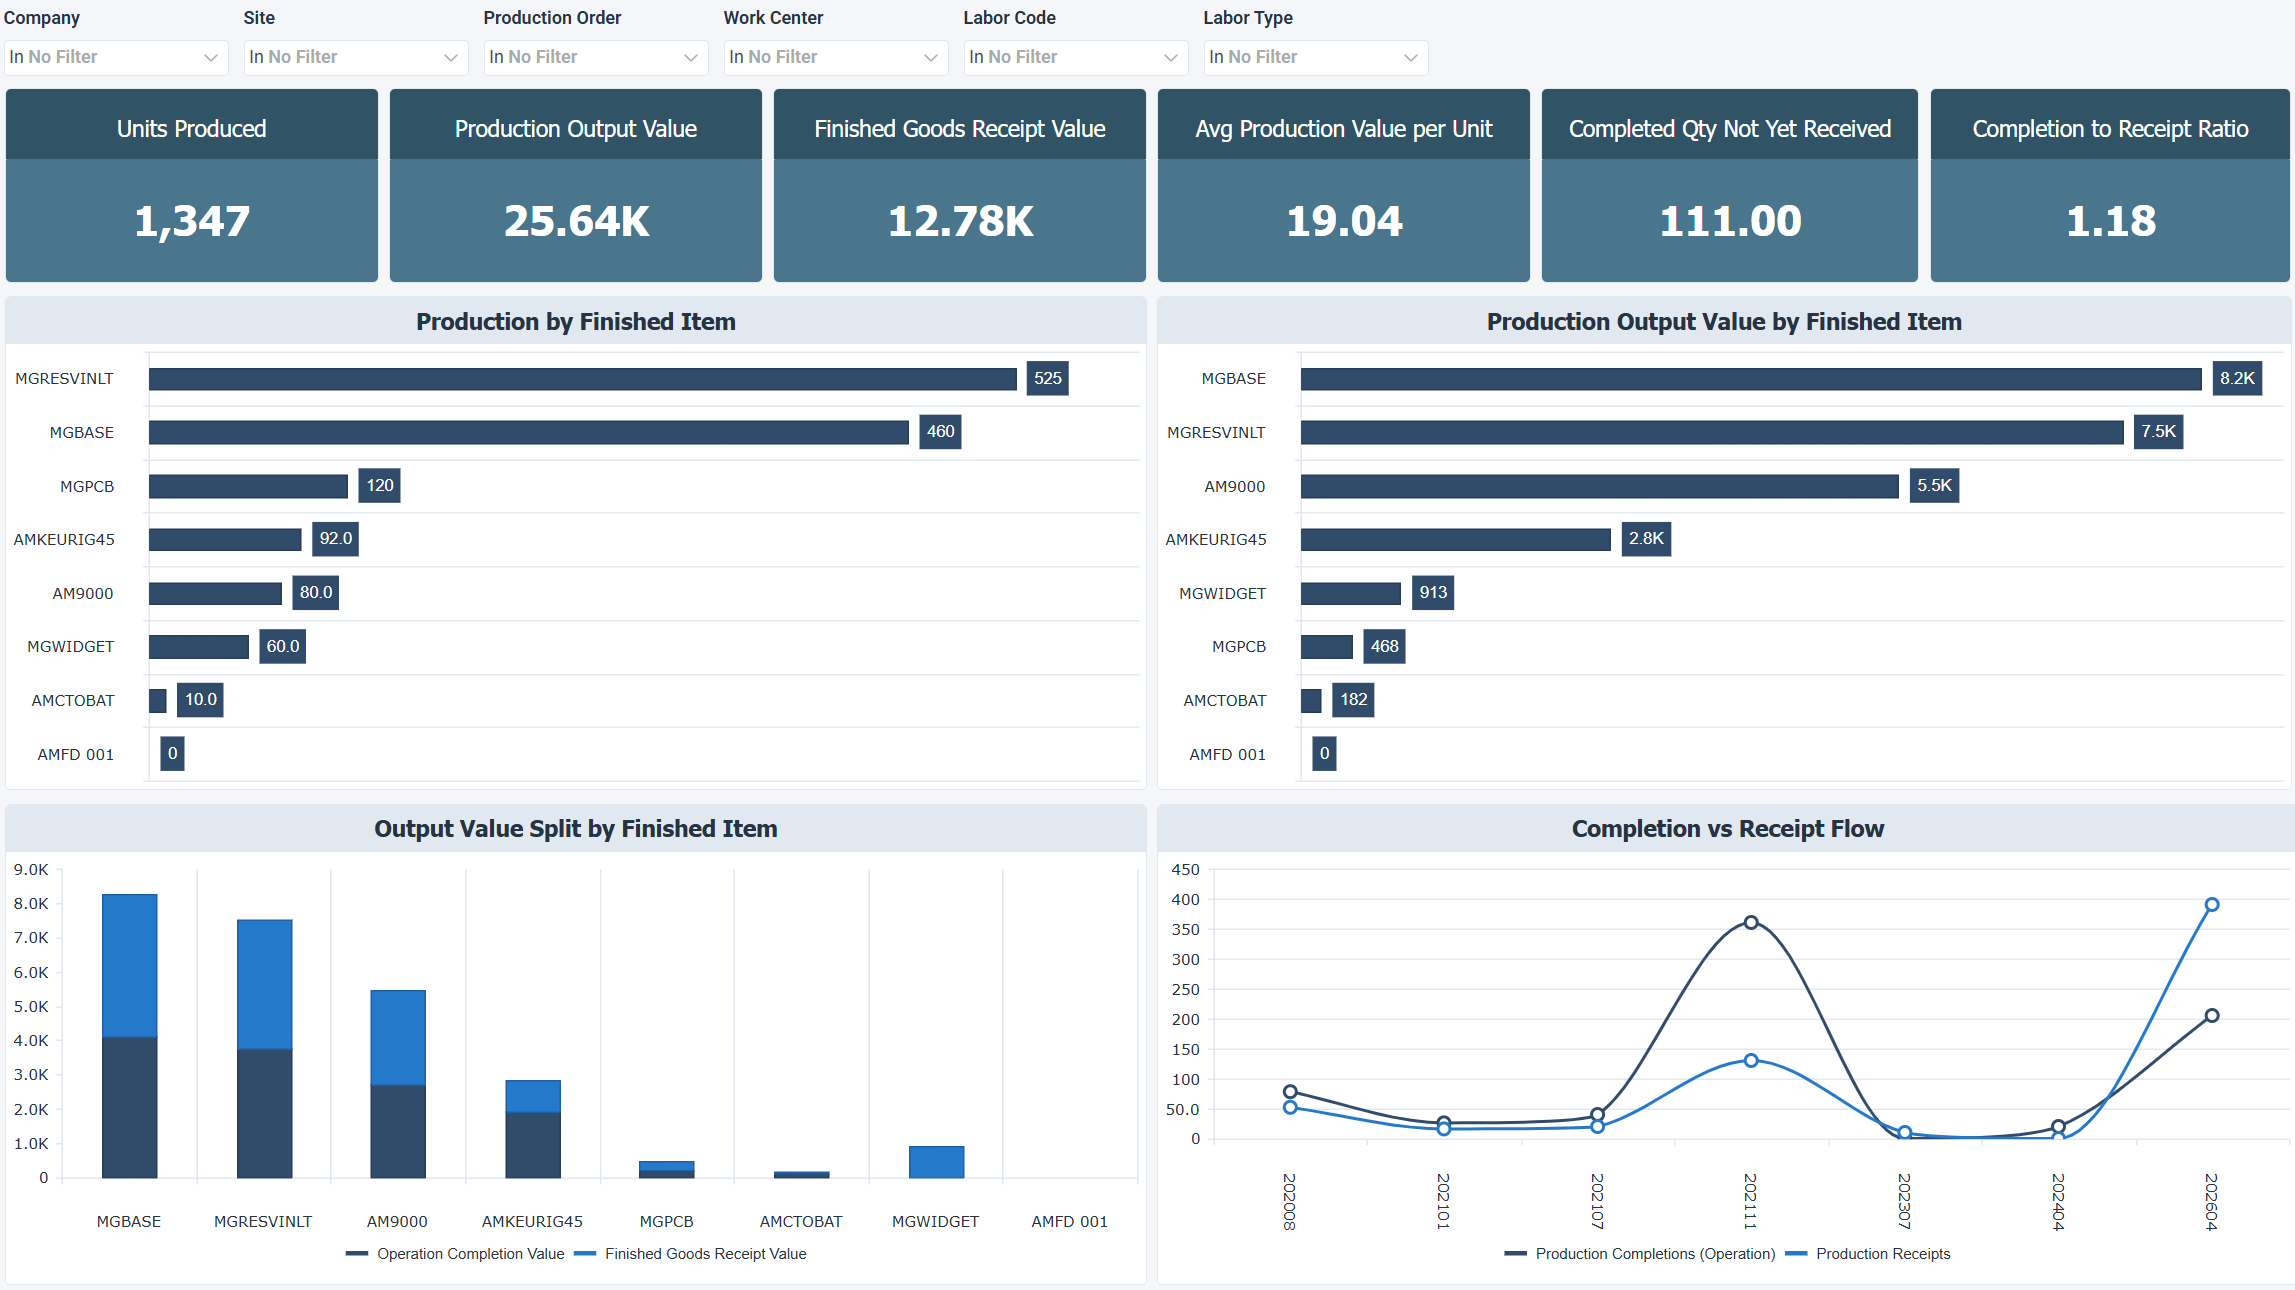
When you review this dashboard, a Completion to Receipt Ratio above 1 means production completes faster than inventory is updated. The gap often points to delays in quality checks, staging, or system processing and not to a production issue itself. Check the Completion vs Receipt Flow chart to see whether the pattern recurs or happened once.
Use this dashboard to follow production throughput, find bottlenecks between completion and receipt, and see which products contribute the most to production volume and value.
How to use the production output and throughput dashboard
- Measure total production output by quantity and value across all finished items.
- Identify gaps between production completion and inventory receipt to detect process or system delays.
- Compare output value against finished goods receipts to assess production-to-inventory alignment.
- Spot the products with the highest volume and value, since they account for the most production activity.
- Follow production flow over time to detect inconsistencies and throughput bottlenecks.
Filters
Use the filtering panel at the top of the Production Output & Throughput dashboard to control which data is shown. The filters apply to all views and ensure the dashboard reflects the selections you choose.
Key performance indicators (KPIs)
The key performance indicators (KPIs) at the top of the dashboard show six production output and inventory receipt measures, and update based on the filters you apply.
| KPI | What it measures |
|---|---|
| Units Produced | Total quantity of units completed across all production orders. |
| Production Output Value | Total value generated from completed production operations, showing the accumulated production cost before the goods are recorded in inventory. |
| Finished Goods Receipt Value | Total value of goods officially received into inventory, which marks the actual inventory transaction. |
| Avg Production Value per Unit | Average value generated per produced unit, which can be compared across products to spot profitability differences and outliers. |
| Completed Qty Not Yet Received | Quantity completed in production but not yet received into inventory, which points to a lag or process delay. |
| Completion to Receipt Ratio | Ratio of production completions to inventory receipts. A value above 1 means production completes faster than inventory is updated. A value near 1 means a balanced flow. |
Visual components
| View name | Type of view | What it shows |
|---|---|---|
| Production by Finished Item | Horizontal Bar | Ranks finished items by quantity produced, identifying high-volume products and production concentration. |
| Production Output Value by Finished Item | Horizontal Bar | Sorts finished items by production output value to show which products carry the most value in the production plan. |
| Output Value Split by Finished Item | Stacked Bar | Compares operation completion value and finished goods receipt value side by side per item, revealing gaps between work completed and work officially received into inventory. |
| Completion vs Receipt Flow | Spline | Follows production completions and inventory receipts over time to show whether the two are aligned or whether delays and bottlenecks exist. |