Executive Sales Summary - TY vs LY
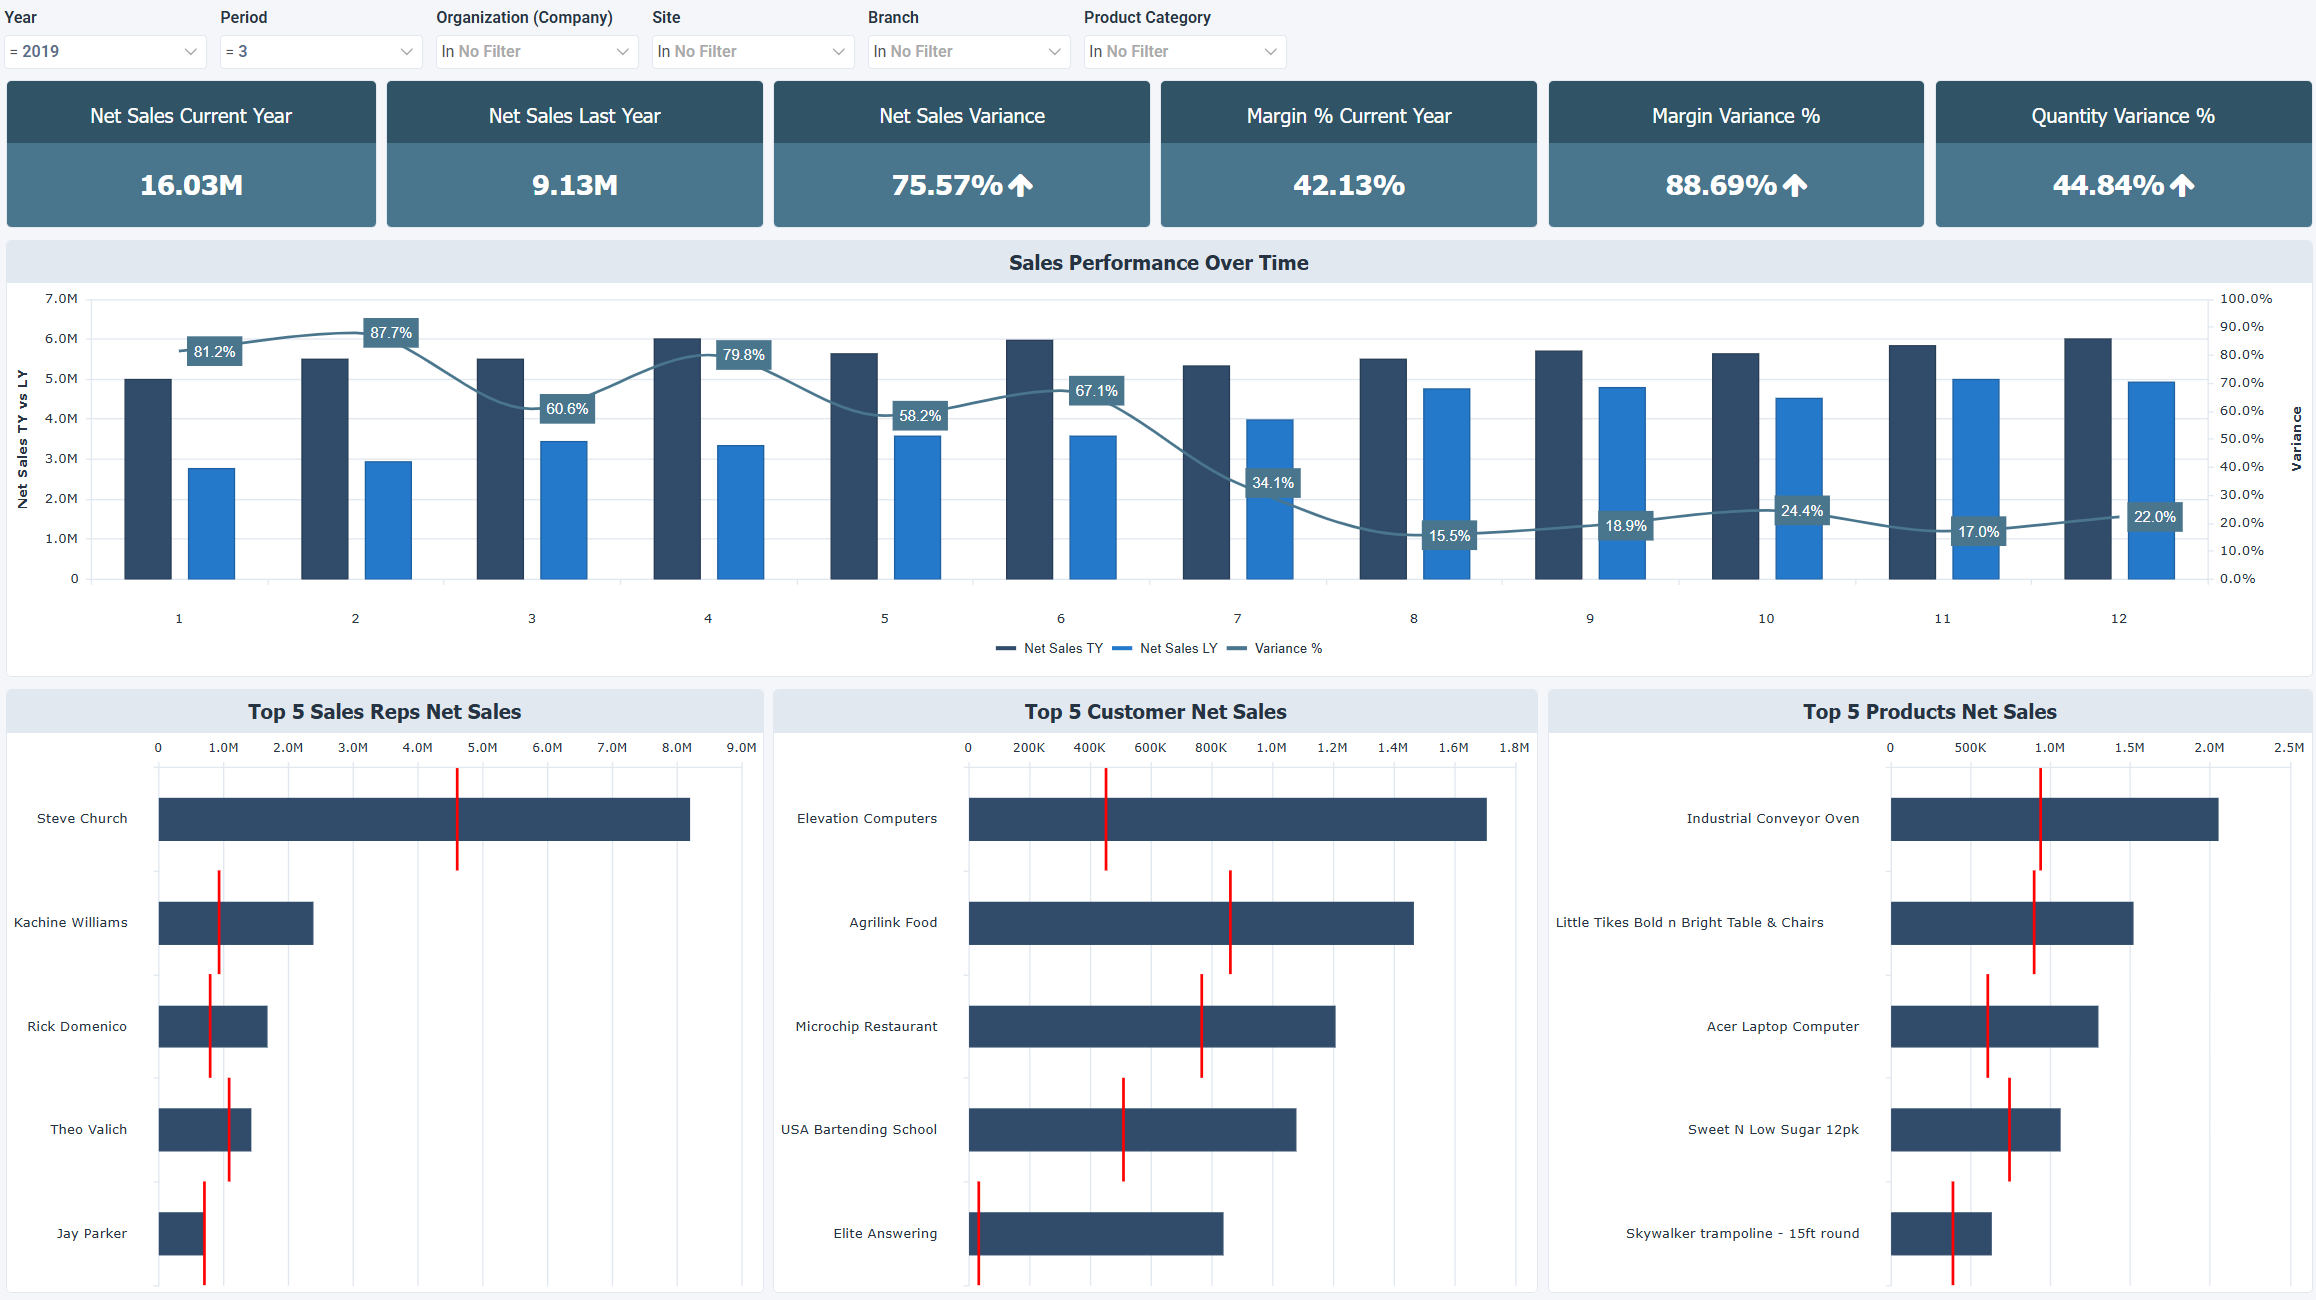
The Executive Sales Summary - TY vs LY dashboard for Acumatica compares this year's sales performance against last year. It tracks revenue trends, margin changes, and where sales are most concentrated, by customer, product, or sales rep.
How to use the executive sales summary dashboard
- Compare net sales year over year using the variance chart to see where revenue is accelerating or declining.
- Monitor margin alongside revenue growth to see whether profitability is tracking with sales.
- Identify top performing sales reps by current year net sales.
- Review customer and product concentration to see where revenue depends most heavily on a small number of accounts or products.
Filters
Use the filtering panel at the top of the Executive Sales Summary dashboard to control which data is shown. The filters apply to all views and ensure the dashboard reflects the selections you choose.
Year: one value
Period: one value
Organization: multiple values
Site: multiple values
Branch: multiple values
Product Category: multiple values
Key performance indicators (KPIs)
The key performance indicators (KPIs) at the top of the dashboard show a year over year summary of net sales, margin, and quantity, and update based on the filters you apply.
| KPI | What it measures |
|---|---|
| Net Sales Current Year | Total recognized sales revenue for the selected fiscal period in the current year. |
| Net Sales Last Year | Total recognized sales revenue for the same period in the prior year, used as the baseline for year over year comparison. |
| Net Sales Variance | The percentage change in net sales between the current year and the prior year, positive for growth and negative for decline. |
| Margin % Current Year | The current year gross margin as a percentage of net sales. |
| Margin Variance % | The year over year percentage change in gross margin, positive when profitability improves and negative when it declines. |
| Quantity Variance % | The year over year percentage change in sales volume, positive for growth and negative when volume decreases. |
Visual components
| View name | Type of view | What it shows |
|---|---|---|
| Sales Performance Over Time | Combination | Plots net sales TY and LY by period with net sales variance % overlaid, showing both absolute performance and the rate of year over year change. |
| Top 5 Sales Reps Net Sales | Horizontal Bullet | Ranks the top 5 sales reps by current year net sales, with last year as a reference line to show individual year over year change. |
| Top 5 Customer Net Sales | Horizontal Bullet | Ranks the top 5 customers by current year net sales, with last year as a reference line to show account level year over year change. |
| Top 5 Products Net Sales | Horizontal Bullet | Ranks the top 5 products by current year net sales, with last year as a reference line to show product level year over year change. |