Project Management
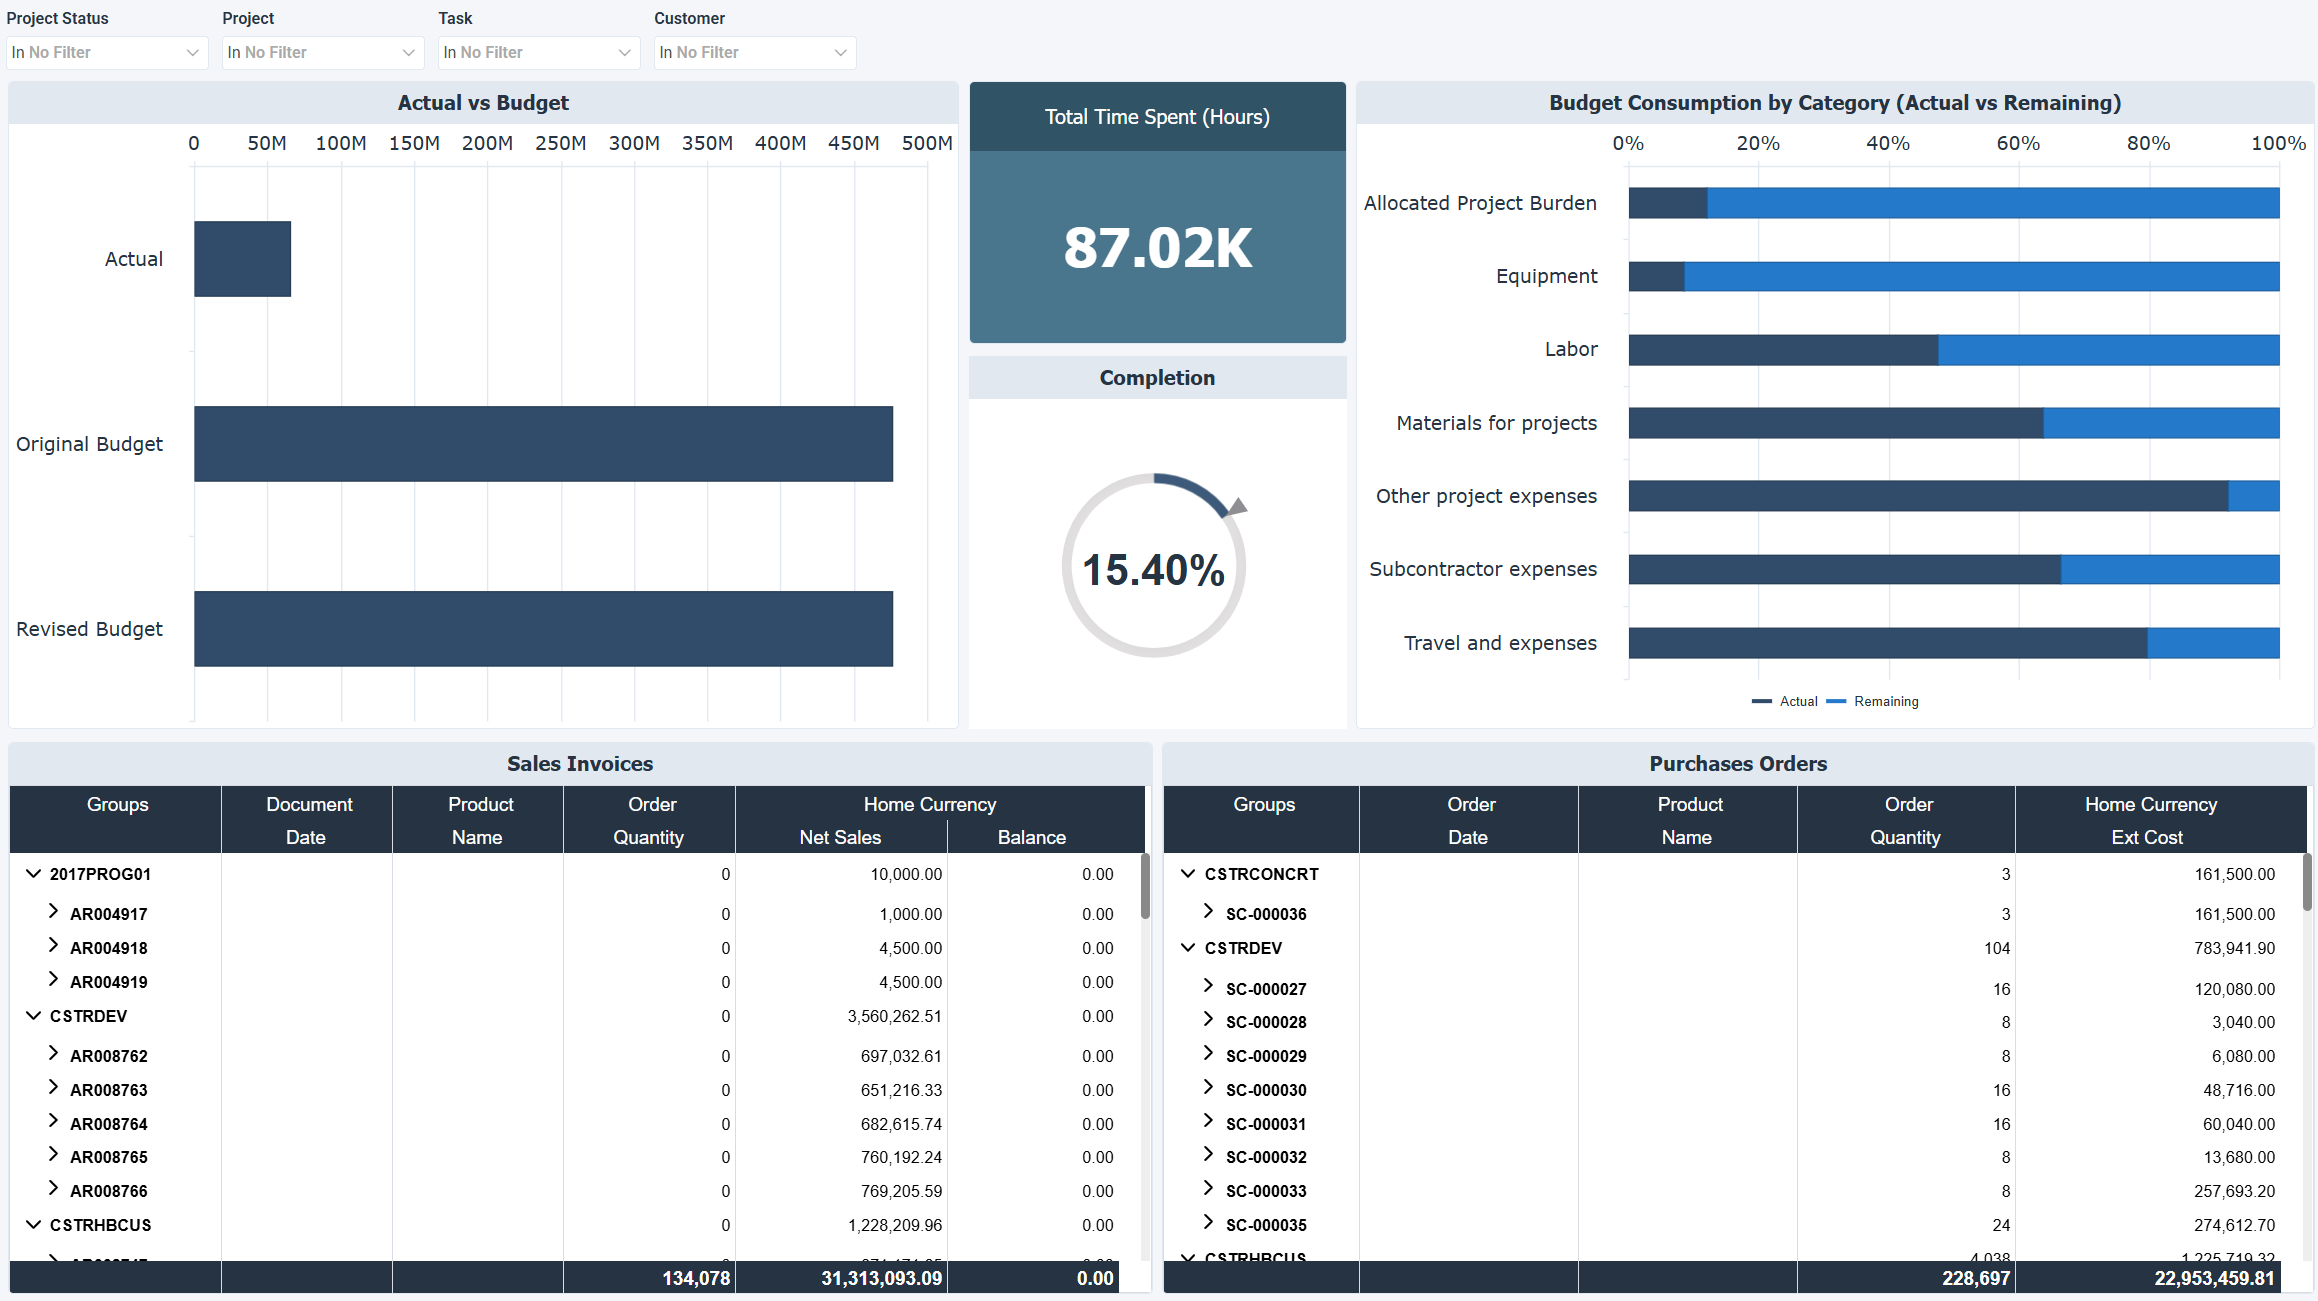
The Project Management dashboard for Acumatica tracks project profitability, expenses, and completion progress. It compares actual results against budgets, breaks down costs by category, and shows hours posted and percentage complete for each project.
How to use the project management dashboard
- Compare actual profitability against budget to see whether a project is tracking to plan.
- Monitor budget consumption by category across labor, subcontractors, materials, and equipment.
- Track hours posted and completion percentage to gauge project progress.
- Review sales invoices and purchase orders tied to a project for underlying transaction detail.
Filters
Use the filtering panel at the top of the Project Management dashboard to control which data is shown. The filters apply to all views and ensure the dashboard reflects the selections you choose.
Project Status: multiple values
Project: multiple values
Task: multiple values
Customer: multiple values
Visual components
| View name | Type of view | What it shows |
|---|---|---|
| Actual vs Budget | Horizontal Bar | Compares actual profitability with the original and revised budgets. |
| Total Time Spent (Hours) | KPI | Shows cumulative hours posted to projects. |
| Completion | Simple Gauge | Shows the percentage of project completion. |
| Budget Consumption | Stacked Bar | Compares actual and remaining budget by expense category (labor, subcontractors, materials, equipment). |
| Sales Invoices | Worksheet | Lists project related sales invoices, including document details, quantities, and net sales. |
| Purchase Orders | Worksheet | Lists project related purchase orders, including items, quantities, and total costs. |