OLAP - Executive Sales Summary
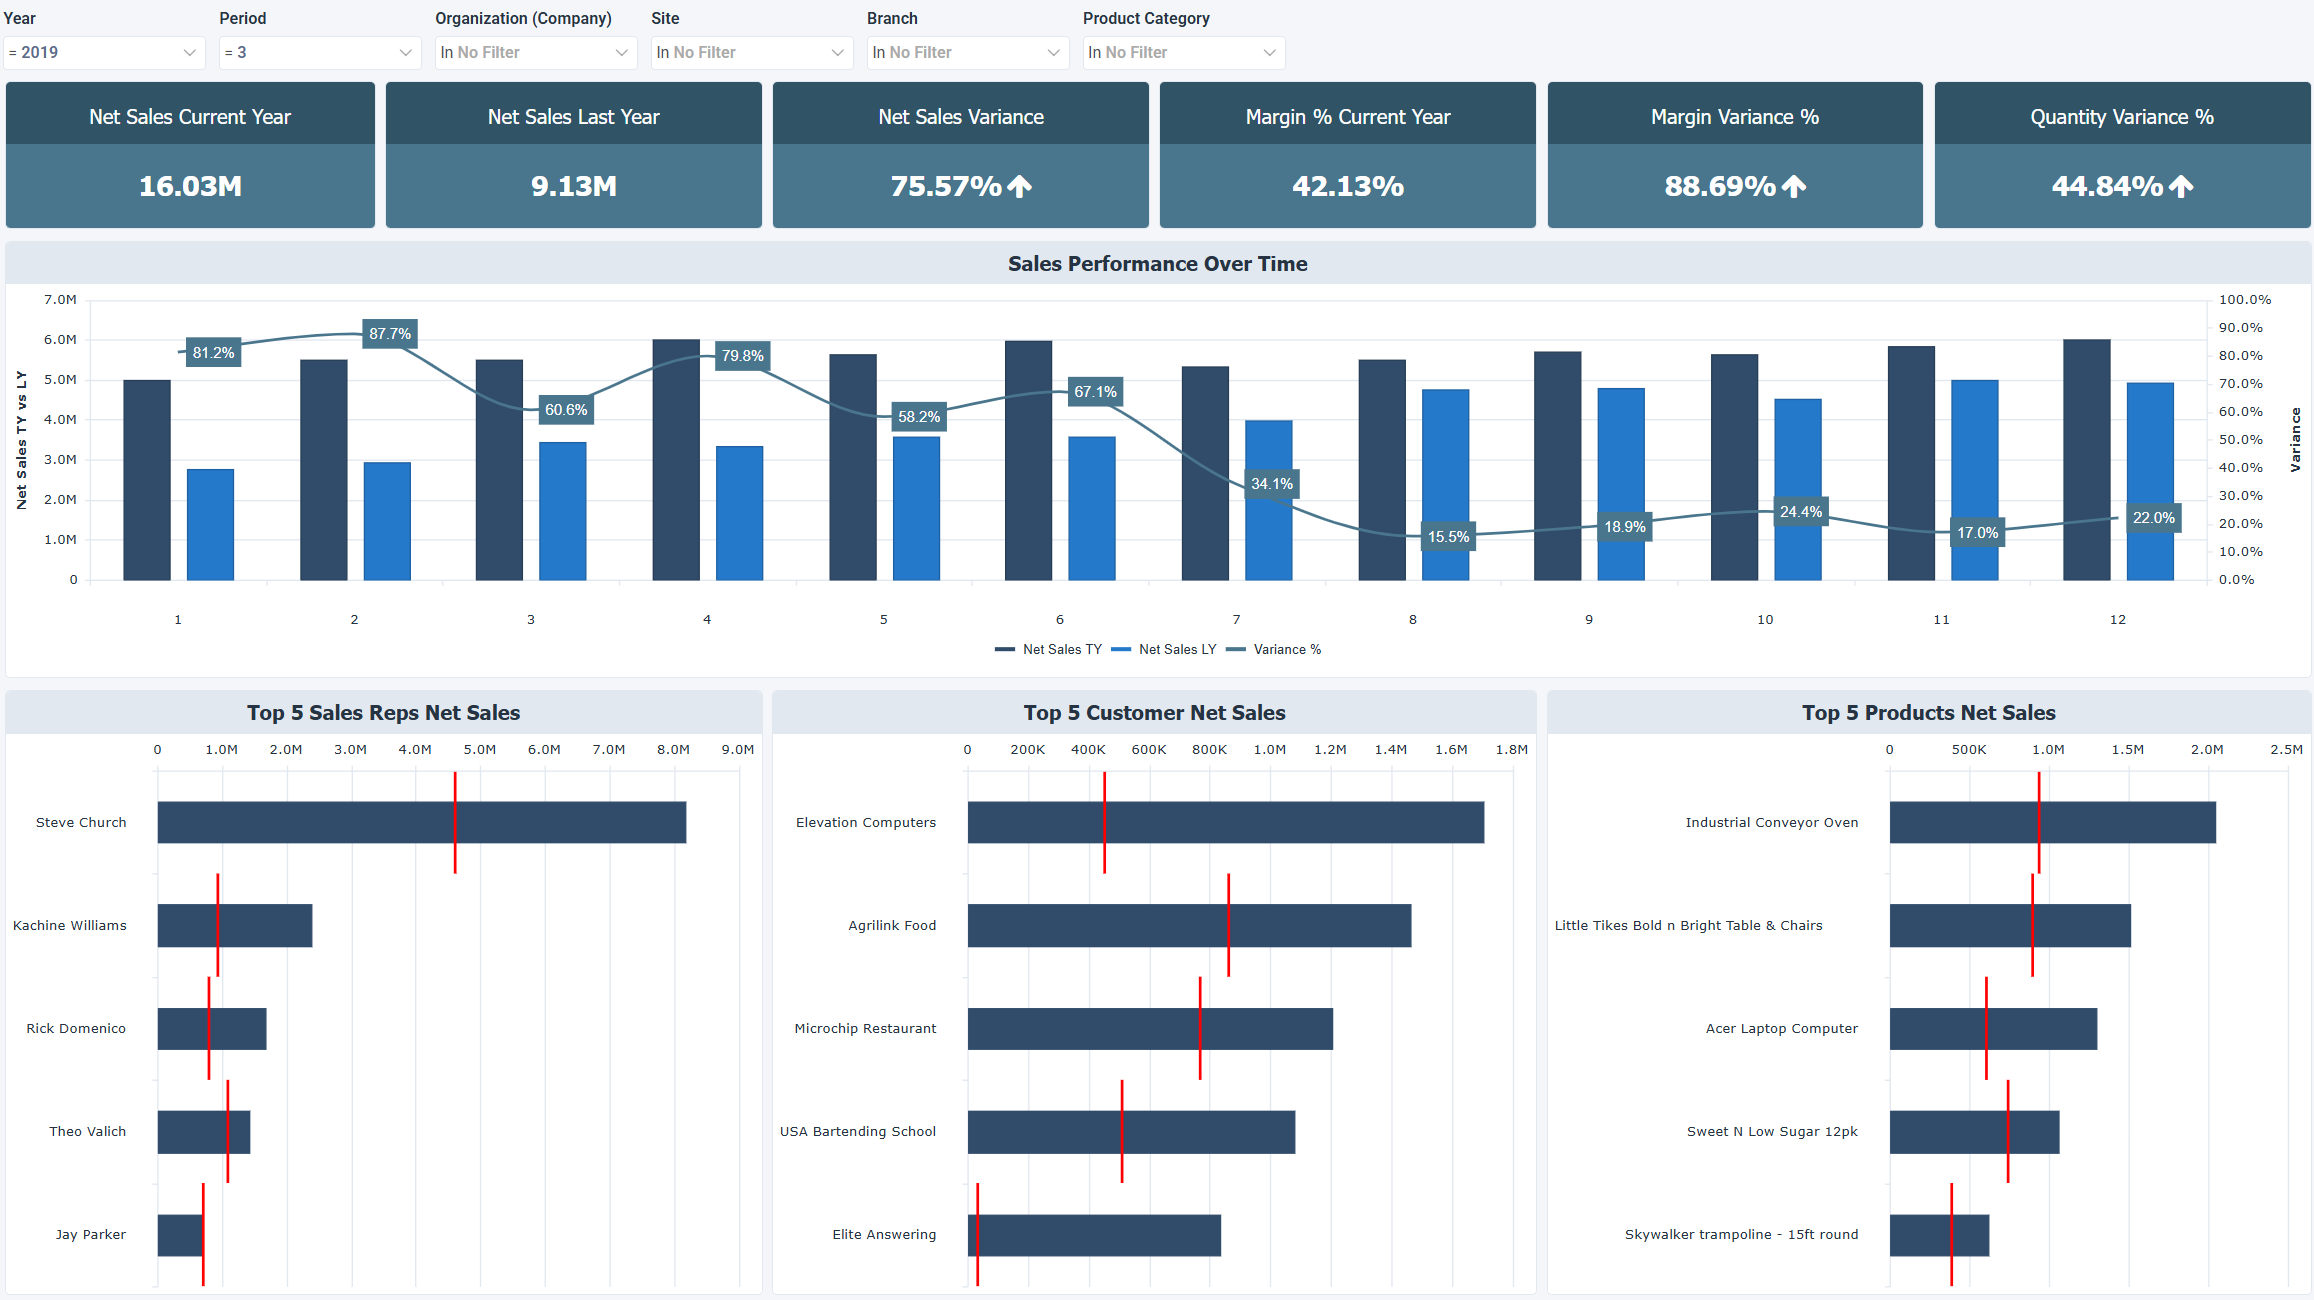
The OLAP - Executive Sales Summary - TY vs LY dashboard for Acumatica presents sales performance, year over year growth, and commercial concentration across customers, products, and sales representatives. It compares revenue between this year and last year, follows margin and volume changes, and shows how much sales depend on top customers, products, and sales representatives.
You need the Data Management add-on to use this dashboard.
How to use the executive sales summary dashboard
- Read sales and margin performance together in one consolidated view of the selected period.
- Compare this year with last year to see where revenue is accelerating or declining, and follow the year over year variance patterns.
- Follow margin changes alongside revenue to see whether margin stays steady while sales move up or down.
- Identify top performing sales representatives by net sales, with last year shown as a reference for each one.
- Check the reliance on key customers and products by looking at how much net sales come from the top 5 of each.
Filters
Use the filtering panel at the top of the OLAP - Executive Sales Summary dashboard to control which data is shown. The filters apply to all views and ensure the dashboard reflects the selections you choose.
Key performance indicators (KPIs)
The key performance indicators (KPIs) at the top of the dashboard show six net sales, margin, and quantity measures for the selected period, and update based on the filters you apply.
| KPI | What it measures |
|---|---|
| Net Sales Current Year | Total recognized sales revenue for the selected fiscal period in the current year. Higher values mean more revenue in the current period, and lower values mean revenue declined or demand was lower. |
| Net Sales Last Year | Total recognized sales revenue for the equivalent period in the prior year, used as the baseline for year over year comparisons. |
| Net Sales Variance | Percentage change in net sales between the current year and the prior year. Higher positive values mean sales grew more, and negative values mean sales declined. |
| Margin % Current Year | Gross margin divided by net sales, shown as a percentage for the current year. Higher values mean more of each sale is retained after costs, and lower values mean less is retained, which can come from cost increases or lower selling prices. |
| Margin Variance % | Percentage change in gross margin compared with last year. Positive values mean gross margin increased, and negative values mean gross margin decreased. |
| Quantity Variance % | Percentage change in sales volume compared with last year. Higher values mean more units were sold, and negative values mean fewer units were sold. |
Visual components
| View name | Type of view | What it shows |
|---|---|---|
| Sales Performance Over Time | Combination | Compares net sales for this year (TY) and last year (LY) by period, with net sales variance % overlaid to show both absolute performance and the rate of year over year change. |
| Top 5 Sales Reps Net Sales | Horizontal Bullet | Ranks the top 5 sales reps by current year net sales, with last year as a reference line to show the year over year change of each rep. |
| Top 5 Customer Net Sales | Horizontal Bullet | Lists the top 5 customers by current year net sales, with last year as a reference line to show the year over year change of each account. |
| Top 5 Products Net Sales | Horizontal Bullet | Sorts the top 5 products by current year net sales, with last year as a reference line to show the year over year change of each product. |