Manufacturing Cost & Efficiency
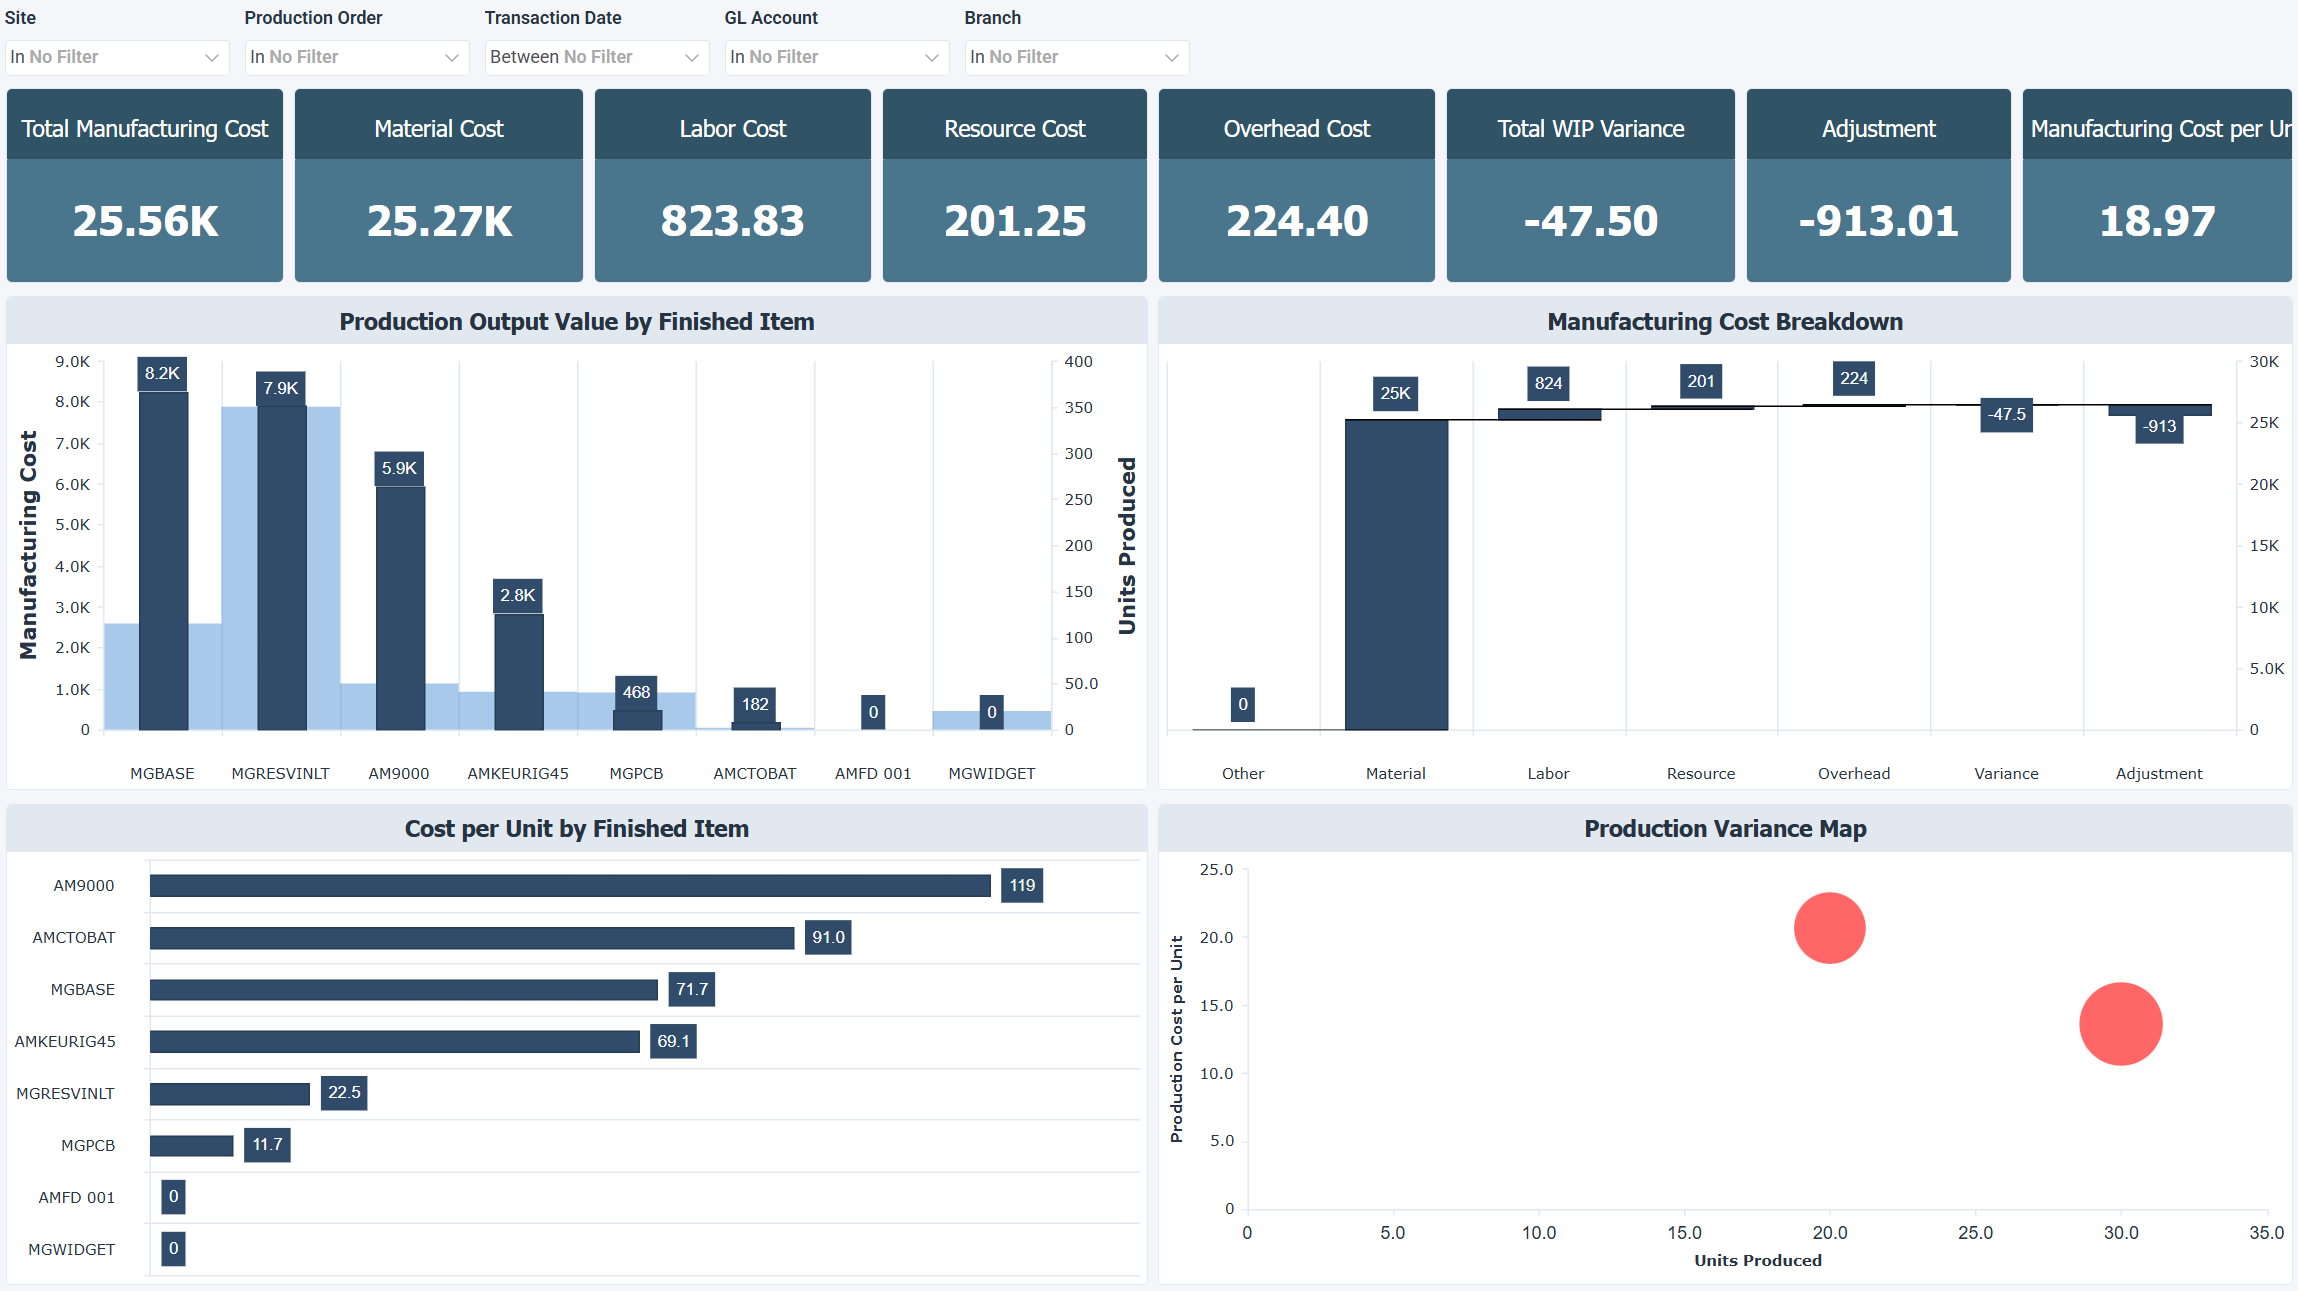
The Manufacturing Cost & Efficiency dashboard for Acumatica shows production costs, cost composition, and cost variance across manufacturing activity. It breaks down how material, labor, resource, and overhead costs add up to total production cost, where variances occur, and which products are the most and least cost efficient to produce. Use this dashboard to control costs, review pricing decisions, and find where manufacturing efficiency can improve.
When you review this dashboard, material cost is usually the largest part of total production cost, which makes it the most likely place to find cost reductions. A negative Total WIP Variance means production is currently running below expected cost, which is favorable as long as the estimates are accurate. Use the Production Variance Map to spot outliers, especially products with high volume and a high cost per unit, which may need a process or pricing review.
How to use the manufacturing cost and efficiency dashboard
- Understand total production cost and how it is composed across material, labor, resource, and overhead.
- Monitor cost variance to detect when actual costs are diverging from planned estimates.
- Compare cost per unit across products to identify inefficiencies and high cost items.
- Relate cost to production volume to assess overall manufacturing efficiency.
- Identify cost outliers that may require a process or pricing review.
Filters
Use the filtering panel at the top of the Manufacturing Cost & Efficiency dashboard to control which data is shown. The filters apply to all views and ensure the dashboard reflects the selections you choose.
Key performance indicators (KPIs)
The key performance indicators (KPIs) at the top of the dashboard show eight manufacturing cost measures, and update based on the filters you apply.
| KPI | What it measures |
|---|---|
| Total Manufacturing Cost | Total accumulated cost across all production activities, including materials, labor, resources, and overhead. |
| Material Cost | Cost of components and raw materials consumed, typically the largest share of total production cost. |
| Labor Cost | Total cost of labor applied to production orders. |
| Resource Cost | Total cost associated with machine and resource usage during production. |
| Overhead Cost | Indirect production costs allocated across manufacturing activity. |
| Total WIP Variance | Difference between expected and actual production cost. A negative value is favorable and means production is running below planned cost. |
| Adjustment | Manual corrections and corrections made by the system, applied to production cost, which you can review to identify anomalies and reconcile costs. |
| Manufacturing Cost per Unit | Average cost to produce one unit, which you can use for pricing decisions and margin analysis. |
Visual components
| View name | Type of view | What it shows |
|---|---|---|
| Production Output Value by Finished Item | Combination | Compares manufacturing cost and units produced by finished item, helping contextualize cost relative to production volume. |
| Manufacturing Cost Breakdown | Waterfall | Adds up material, labor, resource, overhead, variance, and adjustments step by step to reach total production cost. |
| Cost per Unit by Finished Item | Horizontal Bar | Ranks finished items by average cost per unit to identify high cost products and cost inconsistencies across the product range. |
| Production Variance Map | Bubble | Maps each production order by units produced (horizontal axis) against cost per unit (vertical axis), with bubble size reflecting WIP variance. Orders in the top right quadrant combine high volume with high cost per unit and have the greatest effect on total cost. The further right and higher up an order sits, the greater the effect. |