Executive Sales & Profit Summary
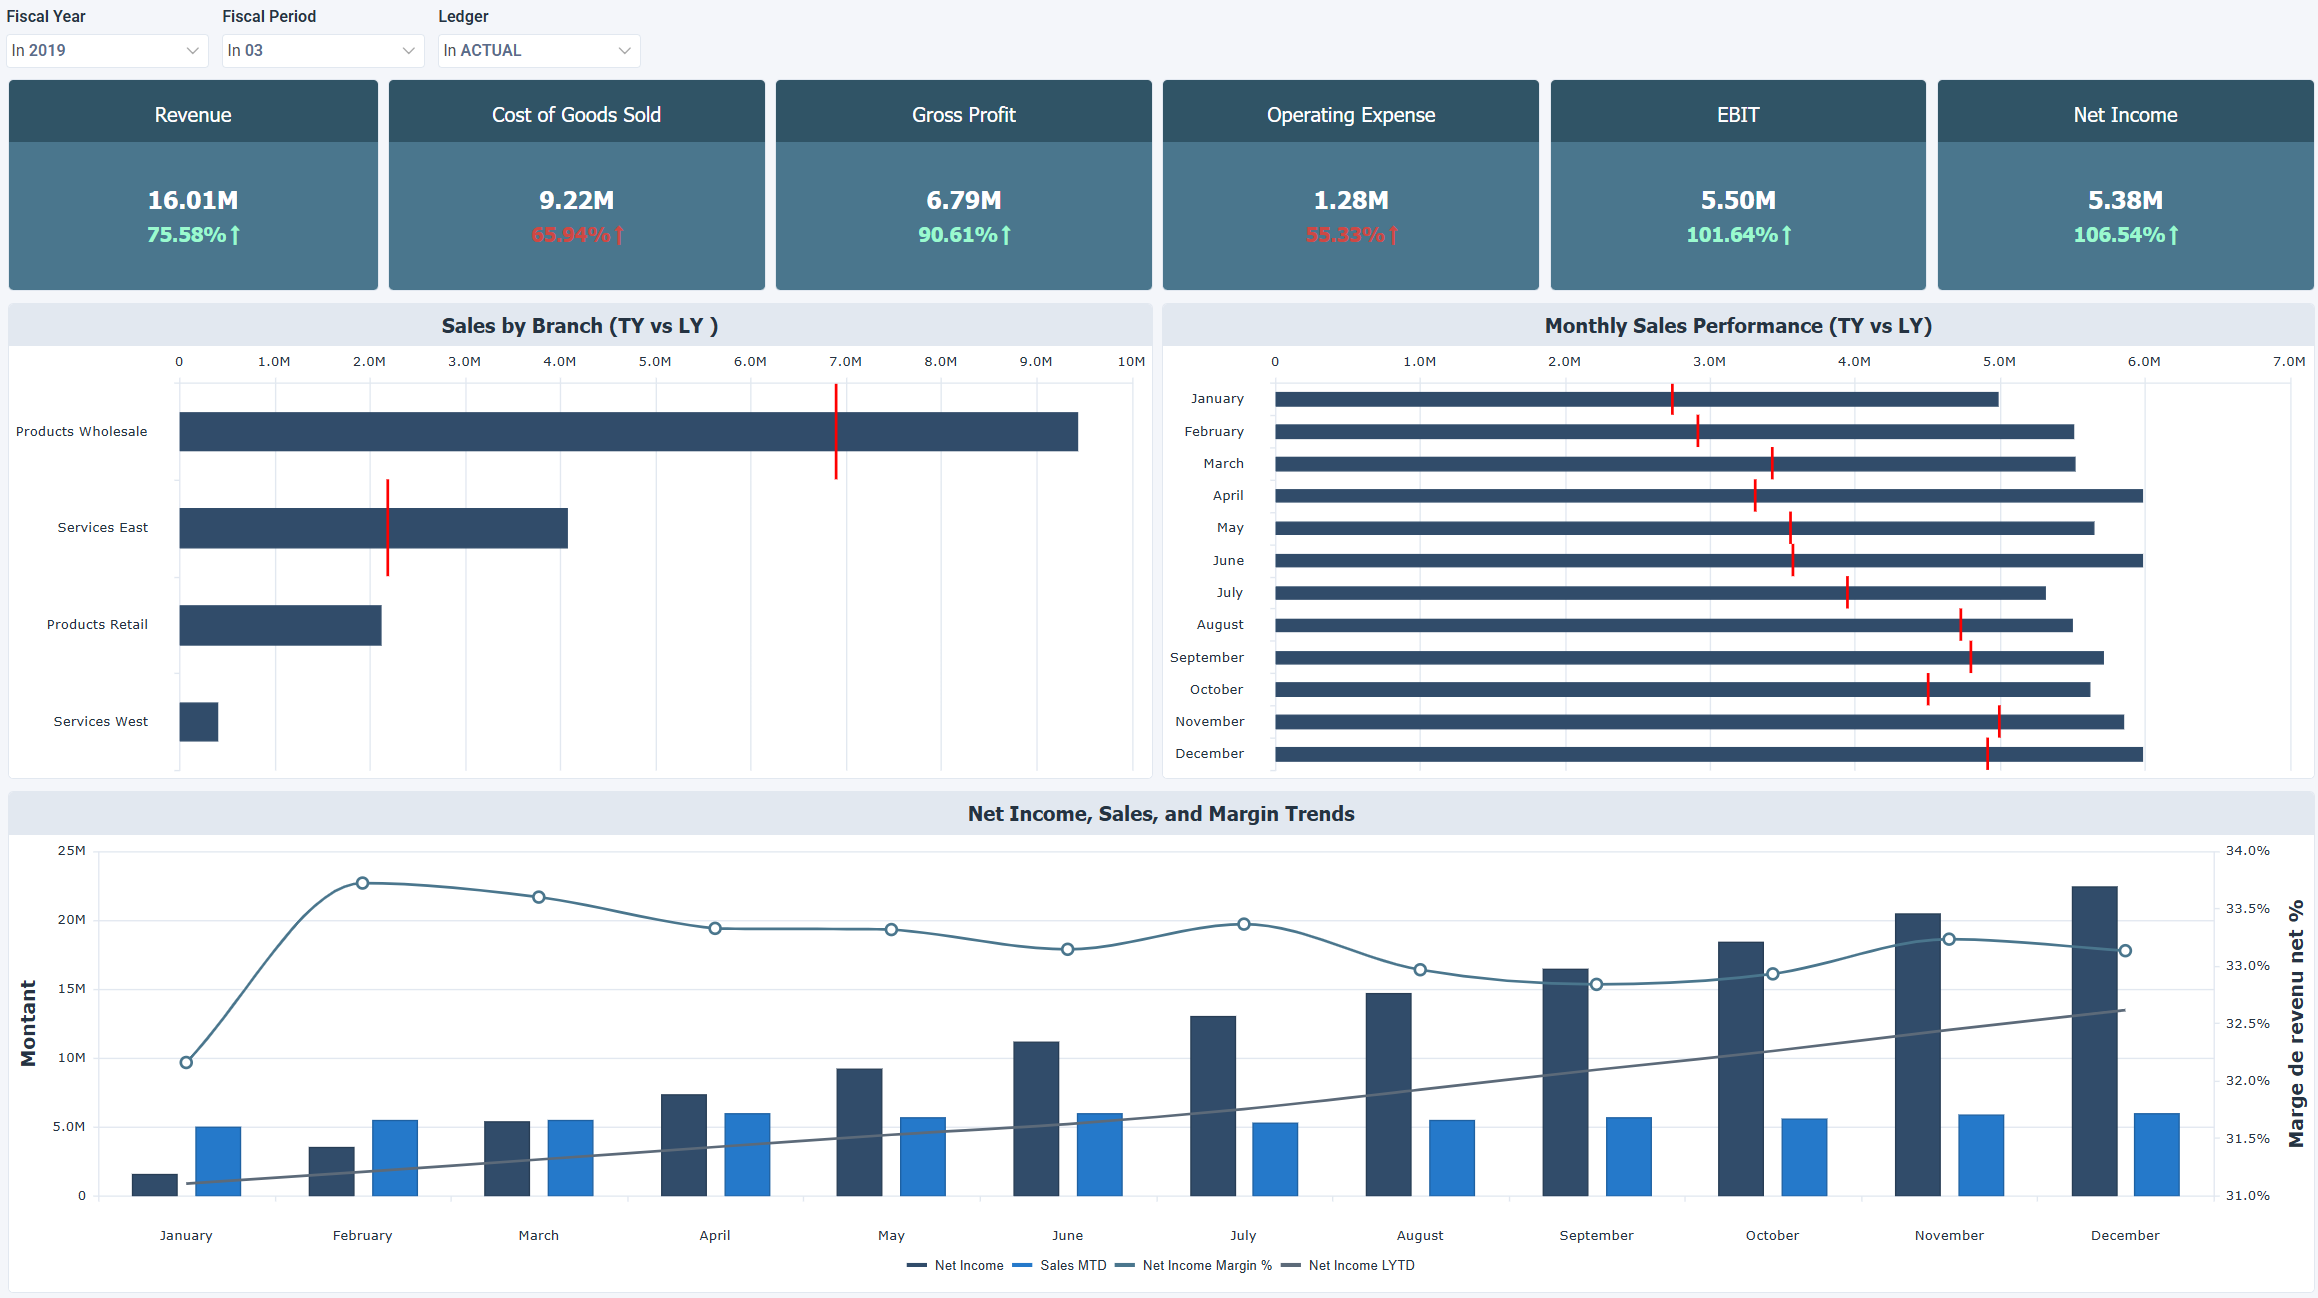
The Executive Sales & Profit Summary dashboard for Acumatica tracks revenue, cost structure, and profitability. Executive leadership uses it to monitor sales performance, operating efficiency, and earnings over time and across organizational dimensions like branch and month.
How to use the executive sales and prodit summary dashboard
- See financial performance at a glance through a consolidated view of revenue, profitability, and operating costs.
- Track profitability using gross profit, EBIT, and net income to evaluate operational and financial efficiency.
- Watch cost trends in operating expenses and COGS to spot where costs are rising.
- Compare sales by branch and by month to identify growth or slowdown patterns.
Filters
Use the filtering panel at the top of the Executive Sales & Profit Summary dashboard to control which data is shown. The filters apply to all views and ensure the dashboard reflects the selections you choose.
Fiscal Year: multiple values
Fiscal Period: multiple values
Ledger: multiple values
Key performance indicators (KPIs)
The key performance indicators (KPIs) at the top of the dashboard show revenue through net income for the selected period, and update based on the filters you apply.
| KPI | What it measures |
|---|---|
| Revenue | Total sales value generated during the selected period. |
| Cost of Goods Sold | Direct costs attributable to the goods sold, shown relative to revenue to highlight cost levels. |
| Gross Profit | Difference between revenue and COGS, showing how much remains before operating expenses. |
| Operating Expense | Total indirect costs to run the business, including administrative and overhead expenses. |
| EBIT | Earnings before interest and taxes, excluding financing and tax impacts. |
| Net Income | Final profit or loss after all expenses, interest, and taxes for the selected period. |
Visual components
| View name | Type of view | What it shows |
|---|---|---|
| Sales by Branch: TY vs LY | Horizontal Bullet | Compares this year's sales against last year by branch, with the bar showing TY and the reference line showing LY. |
| Monthly Sales Performance | Horizontal Bullet | Compares this year's sales against last year by month, showing which months are ahead or behind. |
| Net Income, Sales, and Margin Trends | Combination | Plots net income, sales MTD, net income margin %, and net income LYTD together over time to show how profitability and sales evolve month by month. |