Cash Flow & Burn Analysis
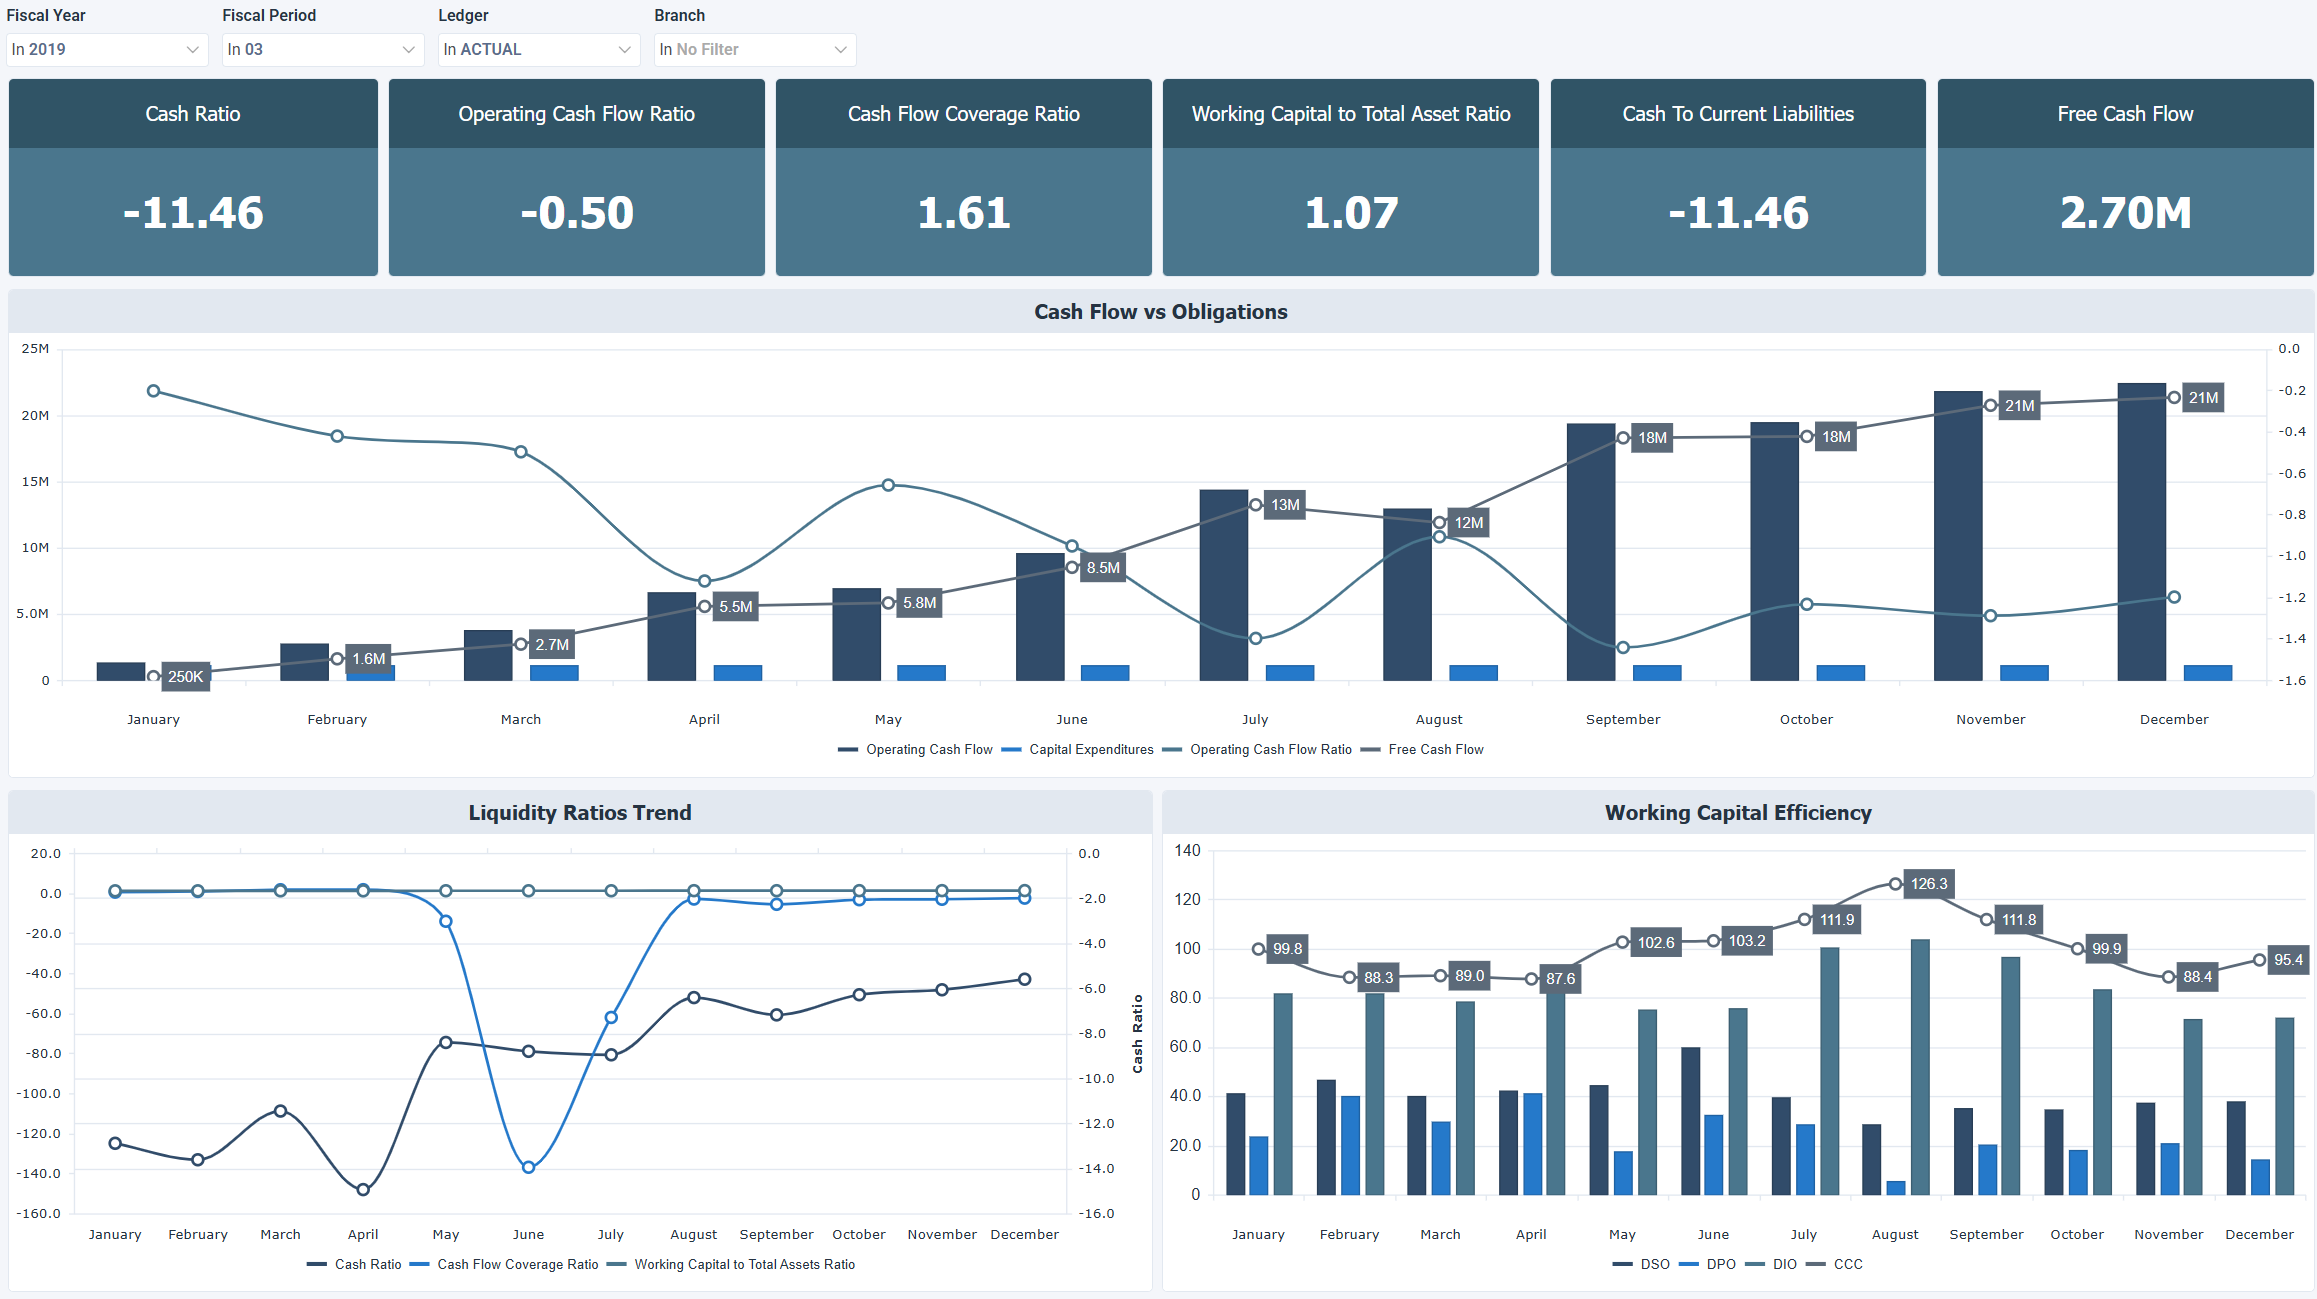
The Cash Flow & Burn Analysis dashboard for Acumatica tracks liquidity, cash generation, and free cash flow month by month. It covers cash ratios, operating cash flow measured against current liabilities and total debt, capital expenditures, and the number of days cash stays tied up in receivables, payables, and inventory.
How to use the cash flow and burn analysis dashboard
- Spot liquidity pressure in the months where the cash ratio and cash flow coverage ratio drop.
- Check operating cash performance against current liabilities using the operating cash flow ratio.
- Trace the effect of capital expenditures on free cash flow across each month.
- Follow days sales, payables, and inventory outstanding to see how many days cash stays tied up in the business.
- Gauge debt coverage with the cash flow coverage ratio, which divides operating cash flow by total debt.
Filters
Use the filtering panel at the top of the Cash Flow & Burn Analysis dashboard to control which data is shown. The filters apply to all views and ensure the dashboard reflects the selections you choose.
Fiscal Year: multiple values
Fiscal Period: multiple values
Ledger: multiple values
Branch: multiple values
Key performance indicators (KPIs)
The key performance indicators (KPIs) at the top of the dashboard show six liquidity and cash flow measures for the selected period, and update based on the filters you apply.
| KPI | What it measures |
|---|---|
| Cash Ratio | Cash and cash equivalents divided by current liabilities. Higher values mean cash alone covers more of the current liabilities, and lower values mean less is covered until other short term assets are converted to cash. |
| Operating Cash Flow Ratio | Operating cash flow divided by current liabilities. Higher values mean operations generate more cash compared with current liabilities, and lower values mean operations generate less. |
| Cash Flow Coverage Ratio | Operating cash flow divided by total debt. Higher values mean operating cash flow covers more of the total debt, and lower values mean more of the debt must be repaid from sources other than operations. |
| Working Capital to Total Asset Ratio | Working capital divided by total assets. Higher values mean current assets exceed current liabilities by a larger amount relative to total assets, and lower values mean the excess is smaller or negative. |
| Cash To Current Liabilities | Cash divided by current liabilities. Higher values mean more of the current liabilities could be paid immediately with cash on hand, and lower values mean less could be paid that way. |
| Free Cash Flow | Operating cash flow minus capital expenditures. Higher values mean more cash remains for debt repayment, reinvestment, or distributions, and negative values mean capital expenditures exceed operating cash flow. |
Visual components
| View name | Type of view | What it shows |
|---|---|---|
| Cash Flow vs Obligations | Combination | Plots operating cash flow, capital expenditures, operating cash flow ratio, and free cash flow month by month to show whether cash generation keeps pace with spending. |
| Liquidity Ratios Trend | Combination | Compares the cash ratio, cash flow coverage ratio, and working capital to total assets ratio month by month to track how liquidity evolves over time. |
| Working Capital Efficiency | Combination | Tracks DSO, DPO, DIO, and the cash conversion cycle (CCC) month by month to show how long cash is tied up in receivables, payables, and inventory. |