Cost Structure & Expense Efficiency
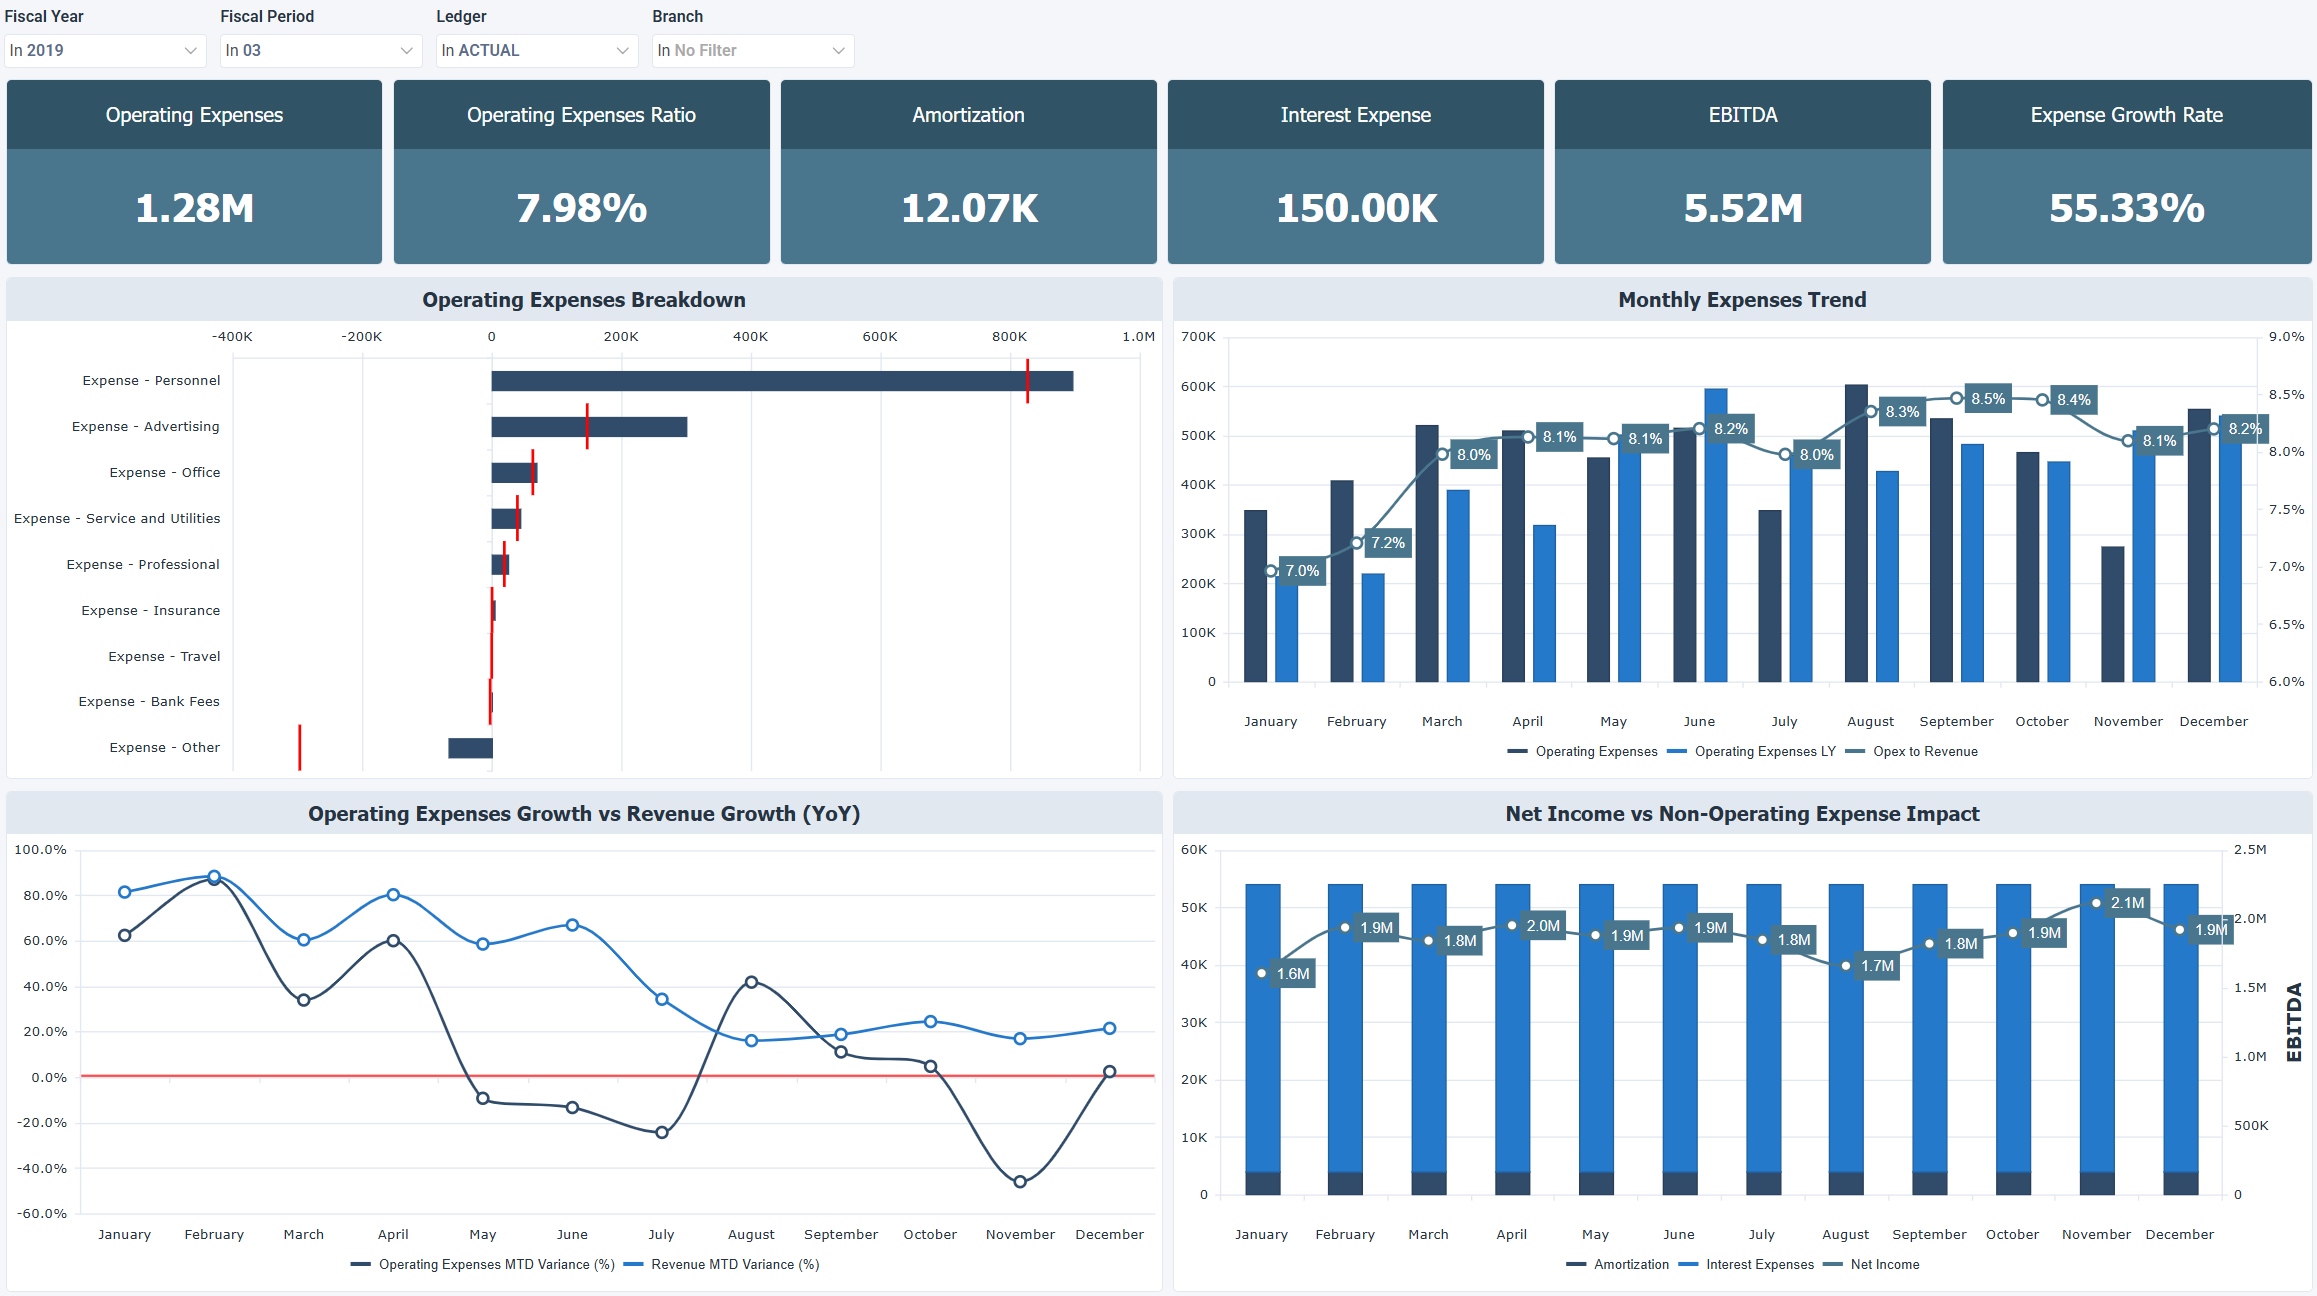
The Cost Structure & Expense Efficiency dashboard for Acumatica provides a consolidated view of operating costs, expense efficiency, and profitability impact. It covers how expenses divide across categories, how cost growth compares with revenue, the impact of non operating costs, and EBITDA performance.
How to use the cost structure and expense efficiency dashboard
- Catch emerging inefficiencies and potential overruns by following how operating expenses behave over time.
- Set expense levels against EBITDA to see how spending relates to profitability.
- Check whether expense growth matches revenue growth across the months.
- Trace the effect of amortization and interest on net income.
- Pinpoint which expense categories concentrate the most spending and how their variances trend.
Filters
Use the filtering panel at the top of the Cost Structure & Expense Efficiency dashboard to control which data is shown. The filters apply to all views and ensure the dashboard reflects the selections you choose.
Fiscal Year: multiple values
Fiscal Period: multiple values
Ledger: multiple values
Branch: multiple values
Key performance indicators (KPIs)
The key performance indicators (KPIs) at the top of the dashboard show six operating cost and profitability measures for the selected period, and update based on the filters you apply.
| KPI | What it measures |
|---|---|
| Operating Expenses | Total costs incurred to support core business operations, including administrative, facility, and service costs. Higher values mean more money is spent on these costs, and lower values mean less is spent. |
| Operating Expenses Ratio | Operating expenses divided by revenue. Higher ratios mean a larger share of revenue goes to operating expenses and less revenue remains afterward, and lower ratios mean a smaller share goes to operating expenses. |
| Amortization | The cost of intangible assets spread across the years the assets are used. Higher values mean a larger expense without a cash payment is deducted from earnings, and lower values mean a smaller amount is deducted. |
| Interest Expense | Interest paid on debt obligations. Higher values mean more interest is paid, from either more debt or higher interest rates, and less profit and cash remain. Lower values mean less interest is paid. |
| EBITDA | Earnings before interest, taxes, depreciation, and amortization. Higher values mean more earnings come from core operations, and lower values mean fewer earnings come from core operations. |
| Expense Growth Rate | Percentage change in operating expenses compared with the previous period. Higher rates mean operating expenses increase faster, from cost increases or business expansion, and lower or negative rates mean operating expenses increase more slowly or decrease. |
Visual components
| View name | Type of view | What it shows |
|---|---|---|
| Operating Expenses Breakdown | Horizontal Bullet | Breaks down operating expenses by category (payroll, clerical salaries, sick pay, holiday pay, etc.) with this year shown against last year as a reference line. |
| Monthly Expenses Trend | Combination | Plots operating expenses this year and last year alongside the opex to revenue ratio month by month. |
| Operating Expenses vs Revenue Growth | Spline | Compares operating expenses monthly variance % against revenue monthly variance % to show whether costs are growing faster than income. |
| Net Income vs Non-Operating Expense | Combination | Tracks amortization, interest expenses, and net income month by month alongside EBITDA to show how non operating costs affect the bottom line. |