OLAP - Strategic Financial Health & Efficiency
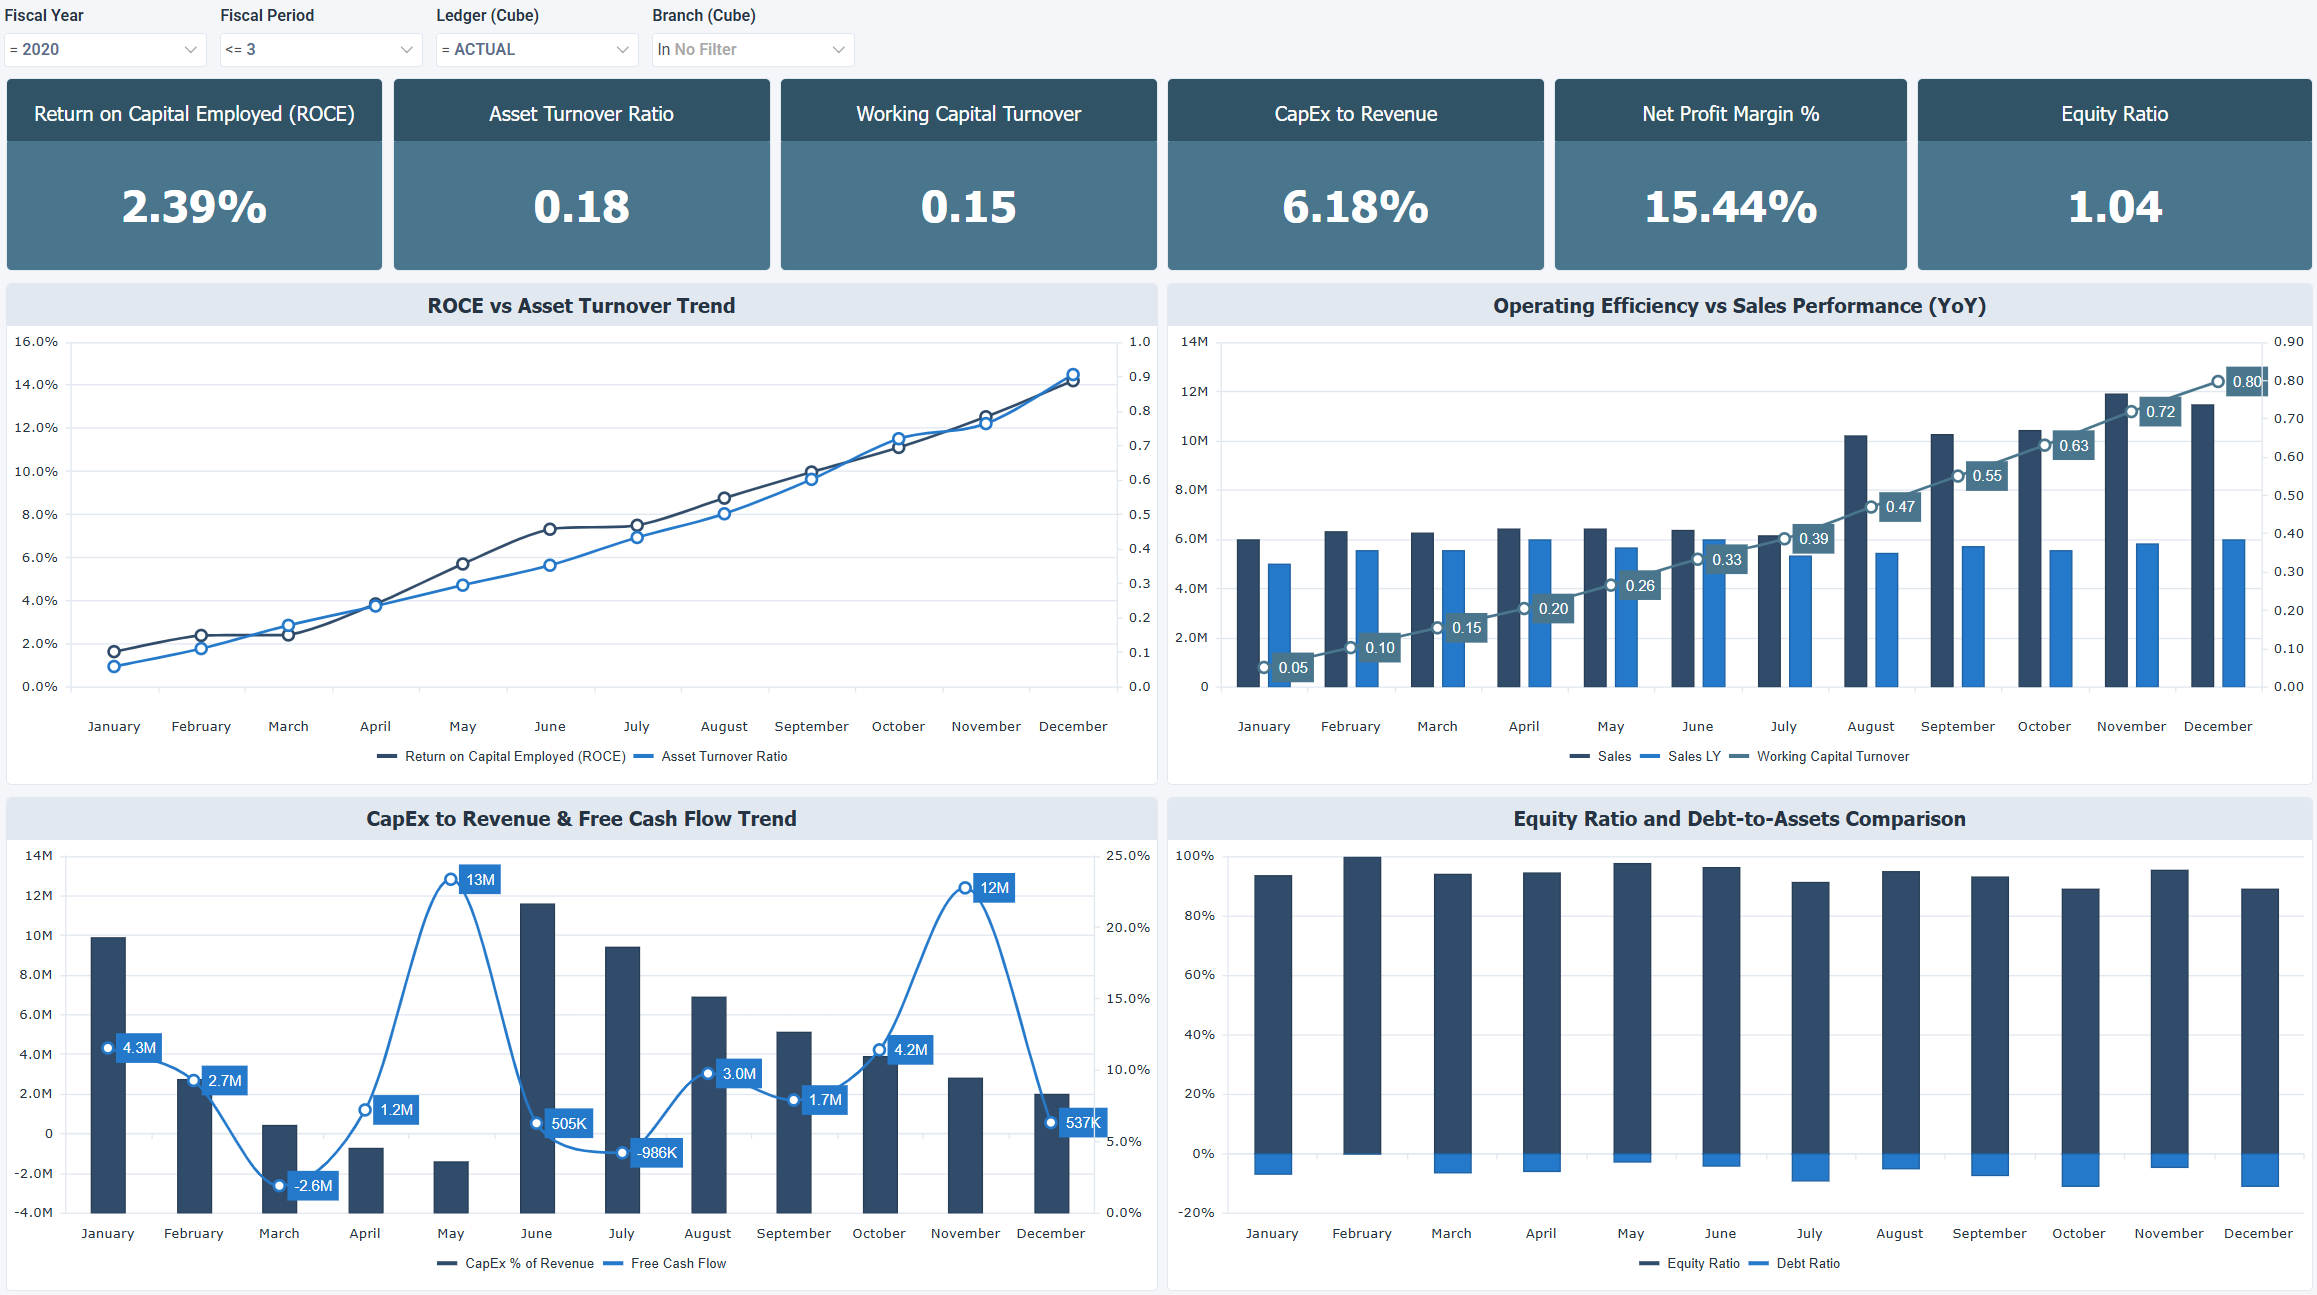
The OLAP - Strategic Financial Health & Efficiency dashboard for Acumatica evaluates capital efficiency, profitability, asset utilization, and balance sheet structure. It shows how invested capital converts into profits, how assets and working capital generate sales, and how the financial structure changes over time.
You need the Data Management add-on to use this dashboard.
How to use the strategic financial health and efficiency dashboard
- Compare invested capital with operating returns to see how much operating profit the capital produces.
- Relate assets and working capital to revenue growth through the asset turnover ratio and the working capital turnover.
- Read net profit margin over time to see how profitability changes alongside pricing, cost structure, and investment.
- Contrast growth investments with revenue generation capacity using CapEx to Revenue and free cash flow.
- Separate equity financing from debt to see the financial structure and solvency in the equity ratio and the debt ratio.
Filters
Use the filtering panel at the top of the OLAP - Strategic Financial Health & Efficiency dashboard to control which data is shown. The filters apply to all views and ensure the dashboard reflects the selections you choose.
Key performance indicators (KPIs)
The key performance indicators (KPIs) at the top of the dashboard show six capital efficiency, profitability, and balance sheet measures for the selected period, and update based on the filters you apply.
| KPI | What it measures |
|---|---|
| Return on Capital Employed (ROCE) | Operating profit divided by total capital employed. Higher values mean more operating profit for each unit of capital, and lower values mean less operating profit or capital that is not fully used. |
| Asset Turnover Ratio | Revenue divided by total assets. Higher values mean the assets produce more revenue, and lower values mean the asset base is larger relative to revenue. |
| Working Capital Turnover | Sales divided by working capital. Higher values mean the working capital produces more sales, and lower values mean more capital is tied up in short term assets. |
| CapEx to Revenue | Capital expenditures divided by revenue, shown as a percentage. Higher values mean a larger share of revenue goes to fixed assets and growth infrastructure, and lower values mean a smaller share goes there or less is reinvested. |
| Net Profit Margin % | Net income divided by total revenue, shown as a percentage. Higher values mean more of each revenue dollar remains as net income, and lower values mean less remains. |
| Equity Ratio | Shareholders' equity divided by total assets. Higher values mean more of the assets are financed by equity, and lower values mean more are financed by debt. |
Visual components
| View name | Type of view | What it shows |
|---|---|---|
| ROCE vs Asset Turnover Trend | Combination | Tracks return on capital employed (ROCE) and asset turnover ratio month by month to show how capital efficiency and asset productivity trend together over time. |
| Operating Efficiency vs Sales Performance | Combination | Compares sales (this year and last year) with working capital turnover month by month to see sales growth against capital efficiency. |
| CapEx to Revenue & Free Cash Flow Trend | Combination | Displays CapEx as a percentage of revenue alongside free cash flow month by month to show how investment levels relate to available cash. |
| Equity Ratio and Debt to Assets Comparison | Stacked Bar | Stacks the equity ratio and debt ratio by month to make the split between equity and debt funding visible over time. |