OLAP - Cash Flow & Burn Analysis
The OLAP - Cash Flow & Burn Analysis dashboard for Acumatica assesses liquidity strength, cash generation capacity, and the ability to sustain operations through internally generated funds. It includes operating cash performance, capital intensity, leverage coverage, and short term solvency on a monthly basis.
Sales and Finance OLAP Cubes
You need the Data Management add-on to use this dashboard.
How to use the cash flow and burn analysis dashboard
- Detect short term liquidity constraints early to see where operational cash shortfalls could occur.
- See how core operations convert revenue into usable cash through the operating cash flow ratio.
- Measure the effect of capital expenditures on free cash flow.
- Read the working capital efficiency trends to see how cash conversion changes over time.
- Test debt servicing and financial stability by checking whether obligations can be met without relying on external financing.
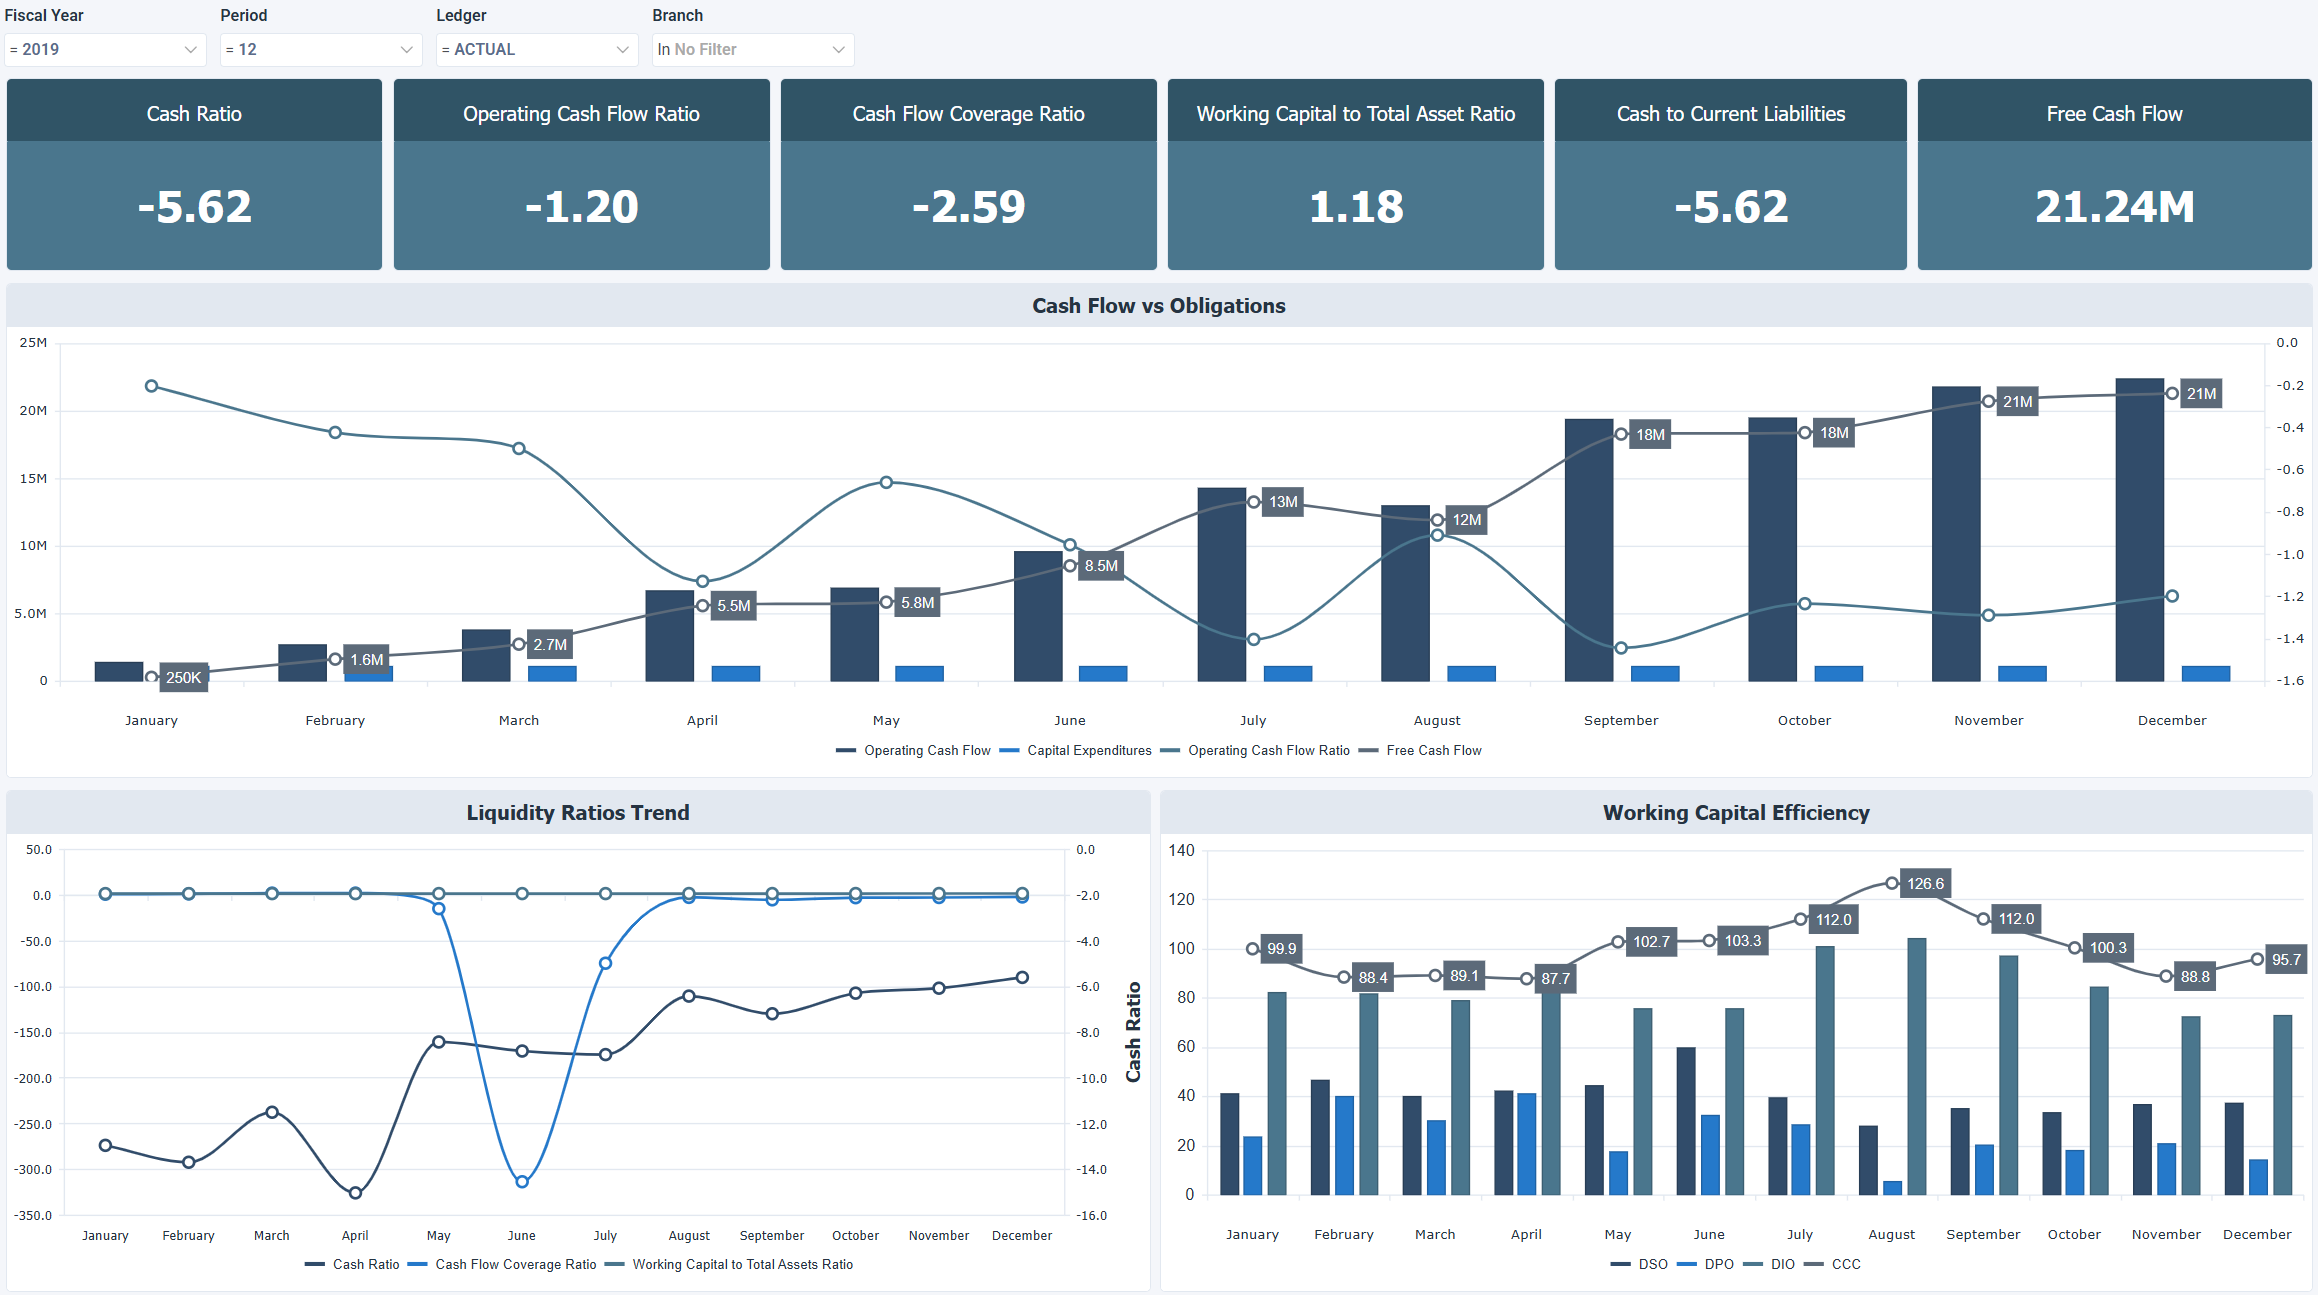
Filters
Use the filtering panel at the top of the OLAP - Cash Flow & Burn Analysis dashboard to control which data is shown. The filters apply to all views and ensure the dashboard reflects the selections you choose.
Fiscal Year: one value
Period: one value
Ledger: one value
Branch: multiple values
Key performance indicators (KPIs)
The key performance indicators (KPIs) at the top of the dashboard show six liquidity and cash flow measures, and update based on the filters you apply.
| KPI | What it measures |
|---|---|
| Cash Ratio | Cash and cash equivalents divided by current liabilities. Higher values mean cash alone covers more of the current liabilities, and lower values mean more reliance on converting other short term assets to meet obligations. |
| Operating Cash Flow Ratio | Operating cash flow divided by current liabilities. Higher values mean operations generate more cash relative to short term obligations, and lower values mean operations generate less. |
| Cash Flow Coverage Ratio | Operating cash flow relative to total obligations. Higher values mean more of the obligations can be paid from operating cash flow, and lower values mean greater dependence on external financing. |
| Working Capital to Total Asset Ratio | Net working capital divided by total assets. Higher values mean a larger share of the assets is financed by net working capital, and lower values mean a smaller share. |
| Cash to Current Liabilities | Available cash divided by current liabilities. Higher values mean more of the current liabilities can be paid with cash on hand, and lower values mean less can be paid that way. |
| Free Cash Flow | Cash generated from operations after capital expenditures. Higher values mean more cash remains for debt repayment, reinvestment, and shareholder returns, and lower or negative values mean less cash is available. |
Visual components
| View name | Type of view | What it shows |
|---|---|---|
| Cash Flow vs Obligations | Combination | Displays operating cash flow, capital expenditures, operating cash flow ratio, and free cash flow month by month to show whether cash generation keeps pace with spending. |
| Liquidity Ratios Trend | Combination | Compares the cash ratio, cash flow coverage ratio, and working capital to total assets ratio month by month to track how liquidity evolves over time. |
| Working Capital Efficiency | Combination | Tracks DSO, DPO, DIO, and CCC month by month to show how long cash is tied up in receivables, payables, and inventory. |