Drill Down Wizard
The Drill Down Wizard shows the detailed data behind a NECFORMULA or a measure in a data extraction. It takes the filters from the formula or extraction and generates a table with the individual rows that make up the aggregated value. Profiles control what fields appear in the drill down and define the level of detail displayed.
The drill down always uses data from the environment configured in the underlying formula or extraction, not the environment currently selected in the navigation panel.
When to drill down
- Investigate an aggregated value to see which individual transactions, invoices, or records make up a total.
- Create reusable profiles that define different levels of detail for the same data model.
- Validate formula results by reviewing the raw data that feeds into a NECFORMULA or extraction measure.
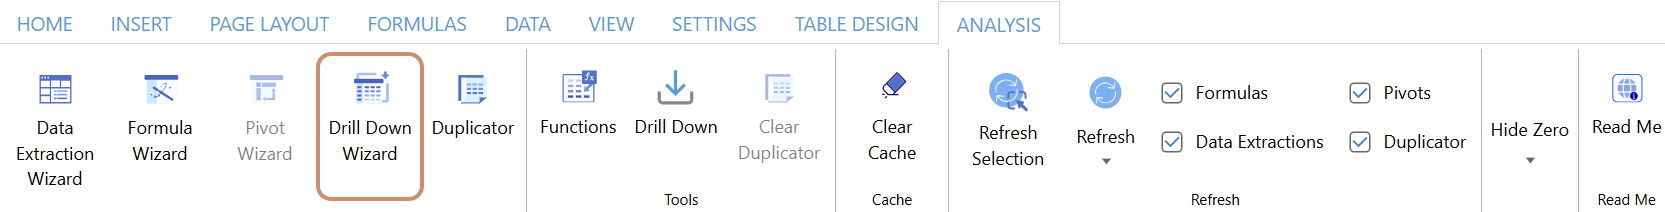
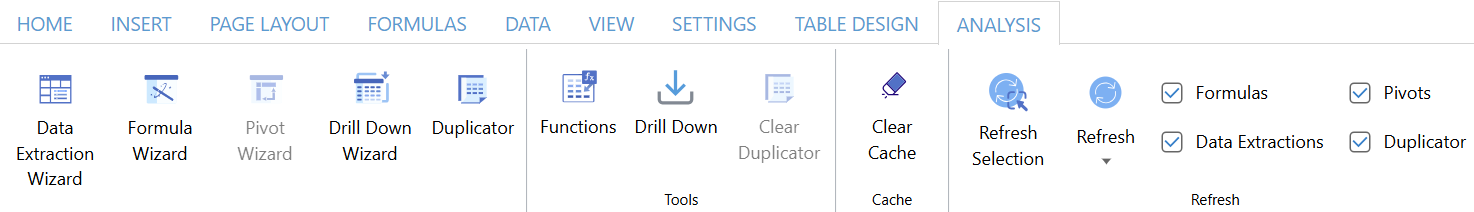
Drill Down Wizard vs. Drill Down button
The Drill Down Wizard and the Drill Down button are two separate actions on the Analysis tab.
| Tool | What it does | When to use it |
|---|---|---|
| Drill Down Wizard | Creates and edits profiles by selecting the data model, fields, grouping, and aggregation. | When you need to configure or modify what fields and detail level appear in a drill down. |
| Drill Down button | Applies an existing profile and opens the drill down table on the right side of the screen. | When a profile already exists and you want to see the detailed data behind a cell. |
Create a profile
A profile defines which fields appear in a drill down table and how they are organized. You can create multiple profiles for the same data model to show different levels of detail depending on the situation. One profile can be set as the default, which means it loads automatically whenever you open a drill down. Profiles are included in import/export templates, so they carry over when you share or migrate workbooks.
After creating or editing profiles, save the workbook to preserve your changes. Profile configurations are stored as part of the workbook, so unsaved changes are lost if you close without saving.
- Select a cell that contains a NECFORMULA or a measure in a data extraction.
- On the Analysis tab, select Drill Down Wizard.
- Click the Profile dropdown and select New Profile.
- Enter a unique name.
- (Optional) Select the translation icon to add translations for the profile name.
- Select Save.
- Click Update.
Set a default profile
- In the Drill Down Wizard, select the profile from the Profile dropdown.
- Select Set as Default.
The default profile loads automatically when you open a drill down on any cell that uses the same data model.
You need to drill down on the same GL data in two different ways: one to trace individual transactions and another to compare department level totals. Instead of reconfiguring the drill down each time, you create two profiles on the same data model.
By Document
Includes document number, posting date, account, and amount with no grouping. Each row is an individual transaction.
By Department
Groups by department with a Sum aggregation on the amount field. Each row is a department total.
Both profiles connect to the same data model but show different levels of detail. Switch between them from the Profile dropdown in the drill down table.
Create a drill down
- Select a cell that contains a NECFORMULA or a measure in a data extraction.
- On the Analysis tab, select Drill Down Wizard.
- Select the data model.
- Select a profile or create a new one.
- On the Fields tab, search for or select the fields to include.
- (Optional) Toggle to show or hide the total row.
- Select Update and Drill Down.
If the cell contains multiple NECFORMULA functions, the left panel lists all formulas in the cell. Select the one you want to drill into before configuring the fields.
Select and configure fields
The Fields tab is where you choose which dimensions, descriptions, and measures to include in the drill down. Search for a field in the left panel, then drag it or double click it to add it to the center area. You must include at least one measure and one dimension.
- Group By determines whether this field is used to group rows. When off, it’s included in the results but doesn’t create groups.
- Order By controls how grouped data is sorted.
- Aggregation reduces the number of rows by applying an operation to the field before the drill down processes it. The drill down calculations are based on this aggregated result, not on raw data.
Open and use the drill down table
Once a profile is configured, you can open the drill down table at any time from the Analysis tab by selecting the Drill Down button. The table appears on the right side of the screen and shows the detailed data behind the selected cell.
When you select a different formula cell, the drill down table updates automatically using the active profile. If the new cell uses a different data model, the drill down switches to the default profile for that model (if one exists).
From the drill down table, you can:
- Switch profiles using the Profile dropdown at the top of the panel.
- Copy the table to a new sheet by selecting the copy icon.
- Toggle filters by selecting the funnel icon. Each column header has a dropdown for sorting, text filters (equals, begins with, contains, etc.), and value selection.
- Apply aggregations to columns by selecting the dropdown on a column header. Available aggregations include Average, Count, Count Numbers, Max, Min, Sum, StdDev, and Var.
- Switch formulas if the cell contains multiple NECFORMULA functions, using the Formula dropdown.
If your data model includes hyperlinks, they appear as clickable links in the drill down table and open in a new browser window. Hyperlinks are preserved if you copy the drill down table to a new sheet.