Cash Flow & Burn Analysis
The Cash Flow & Burn Analysis dashboard for Sage 100 North America focuses on cash position, liquidity ratios, and working capital efficiency. It tracks how cash flows in and out of the business, how liquid the company is relative to its obligations, and how efficiently working capital converts into cash. Use this dashboard to monitor cash health, review liquidity trends, and evaluate the cash conversion cycle.
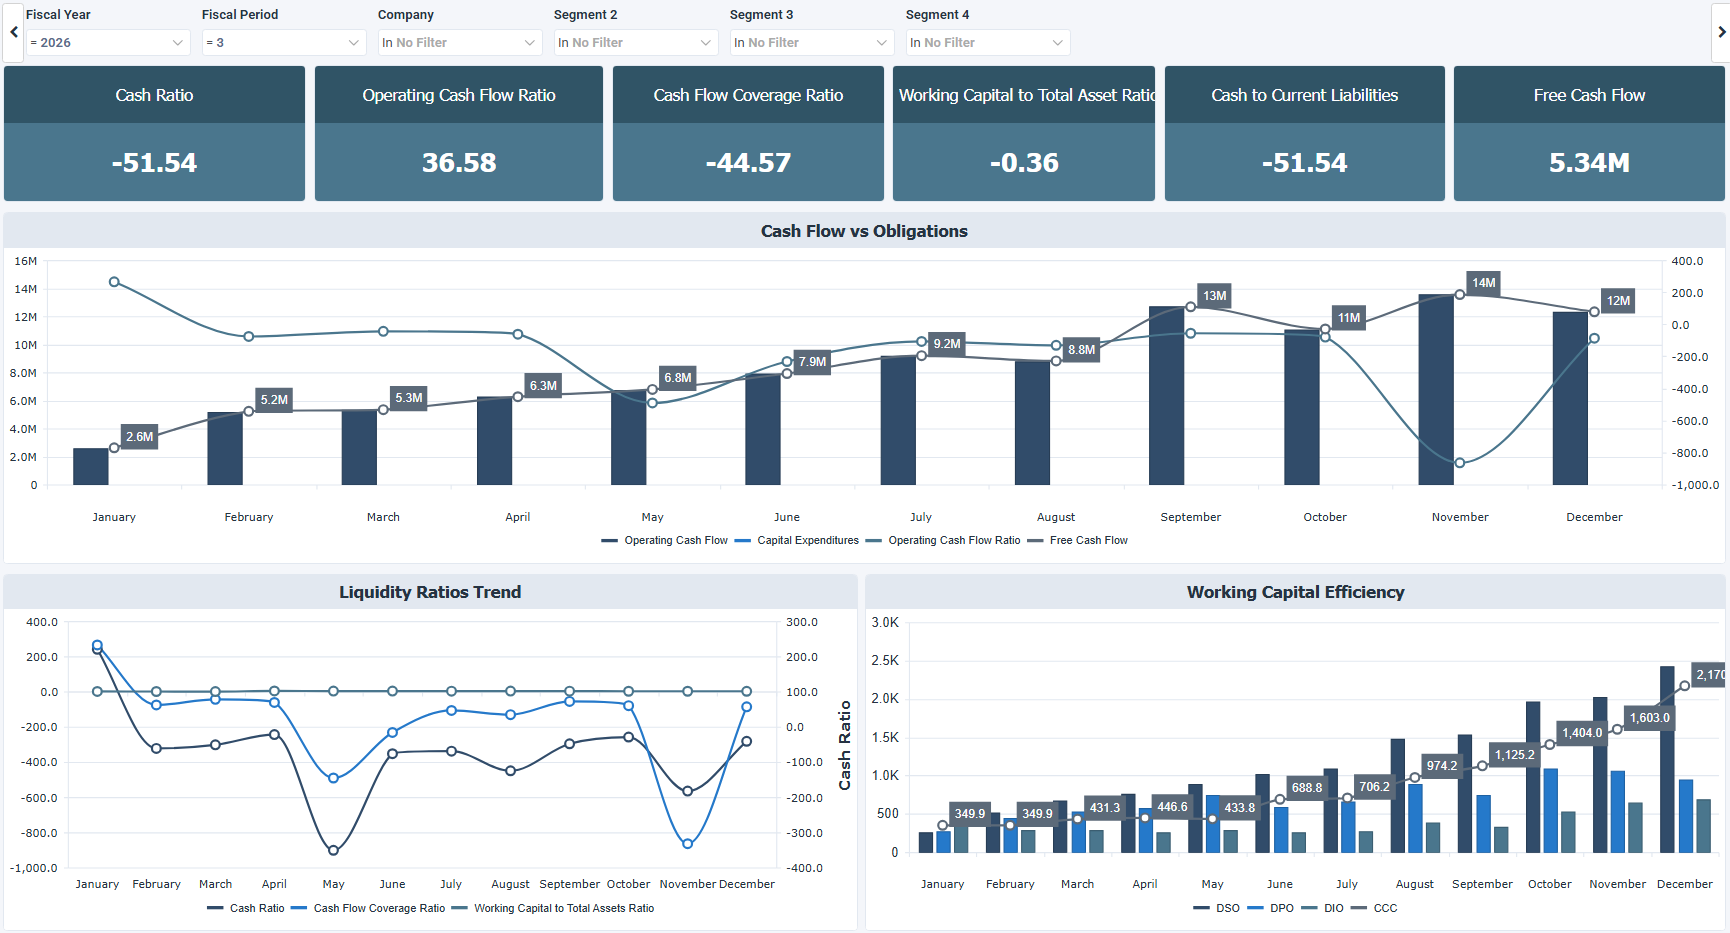
It is organized in three layers. The KPIs and the top chart focus on cash flow relative to obligations, showing whether operating cash flow covers capital expenditures and liabilities. The bottom left chart tracks liquidity ratios over time to show how the cash position evolves month by month. The bottom right chart tracks working capital efficiency through DSO, DPO, DIO, and the cash conversion cycle, which together indicate how long it takes to turn inventory and receivables into cash.
How to use the cash flow and burn analysis dashboard
- Monitor cash ratios to understand how much cash is available relative to current liabilities and total assets.
- Compare cash flow against obligations to see if operating cash flow covers capital expenditures and debt.
- Track liquidity trends over time to spot months where cash position is tightening or improving.
- Evaluate the cash conversion cycle using DSO, DPO, and DIO to understand how long cash is tied up in operations.
Filters
Use the filtering panel at the top of the Cash Flow & Burn Analysis dashboard to control which data is shown. The filters apply to all views and ensure the dashboard reflects the selections you choose.
Key performance indicators (KPIs)
The key performance indicators (KPIs) are displayed at the top of the dashboard. They show cash position and liquidity ratios relative to obligations, and update based on the filters you apply.
| KPI | What it measures |
|---|---|
| Cash Ratio | Cash and cash equivalents divided by current liabilities, showing the ability to cover obligations with cash alone. |
| Operating Cash Flow Ratio | Operating cash flow divided by current liabilities, indicating whether operations generate enough cash to cover short term debts. |
| Cash Flow Coverage Ratio | Operating cash flow divided by total debt, measuring the ability to service debt from operations. |
| Working Capital to Total Asset Ratio | Working capital as a proportion of total assets, reflecting how much of the asset base is liquid. |
| Cash to Current Liabilities | Cash relative to current liabilities, a stricter measure of immediate payment capacity. |
| Free Cash Flow | Operating cash flow minus capital expenditures, representing the cash left after maintaining or expanding the asset base. |
Visual components
| View name | Type of view | What it shows |
|---|---|---|
| Cash Flow vs Obligations | Combination | Plots operating cash flow, capital expenditures, operating cash flow ratio, and free cash flow month by month to show whether cash generation keeps pace with spending. |
| Liquidity Ratios Trend | Combination | Plots cash ratio, cash flow coverage ratio, and working capital to total assets ratio month by month to track how liquidity evolves over time. |
| Working Capital Efficiency | Combination | Plots DSO, DPO, DIO, and the cash conversion cycle (CCC) month by month to show how long cash is tied up in receivables, payables, and inventory. |