Selection Page
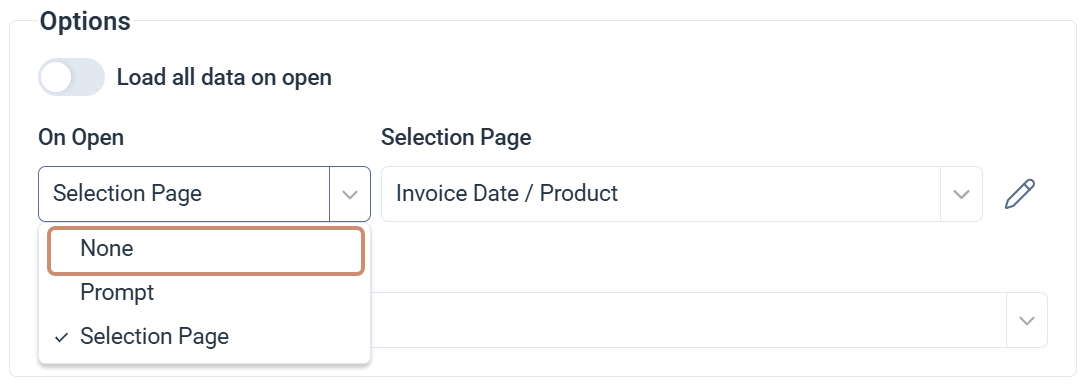
The Selection Page filters data before a visualization loads. For views, the filter fields come from the data model. For dashboards, reports, and workbooks, they come from global parameters. The dialog can appear when you open a view, a dashboard, a report, or a workbook. If a Selection Page is configured in the visualization properties, it opens automatically when the visualization loads.
When to use the Selection Page
- Filtering data before loading: Focus on a specific segment of a large dataset before the visualization opens, which reduces unnecessary data and improves clarity.
- Improving load performance: Limit the amount of data loaded so the visualization renders faster. This is especially useful with large datasets.
- Comparing data across periods: Switch between different datasets or time periods without opening multiple visualizations.
- Exploring data with ad hoc filters: Apply different filters quickly during exploratory analysis without changing the base visualization setup.
- Controlling data access by user: Let each user apply their own filters so they only see data relevant to their role.
Filter a visualization on open
Fields with a gray background are required before you can apply filters.
- Open a view, report, dashboard, or workbook.
- Select fields and enter a value for each. Select the prompt button beside a field to see the available values.
- Select Confirm to load the visualization with your filters.
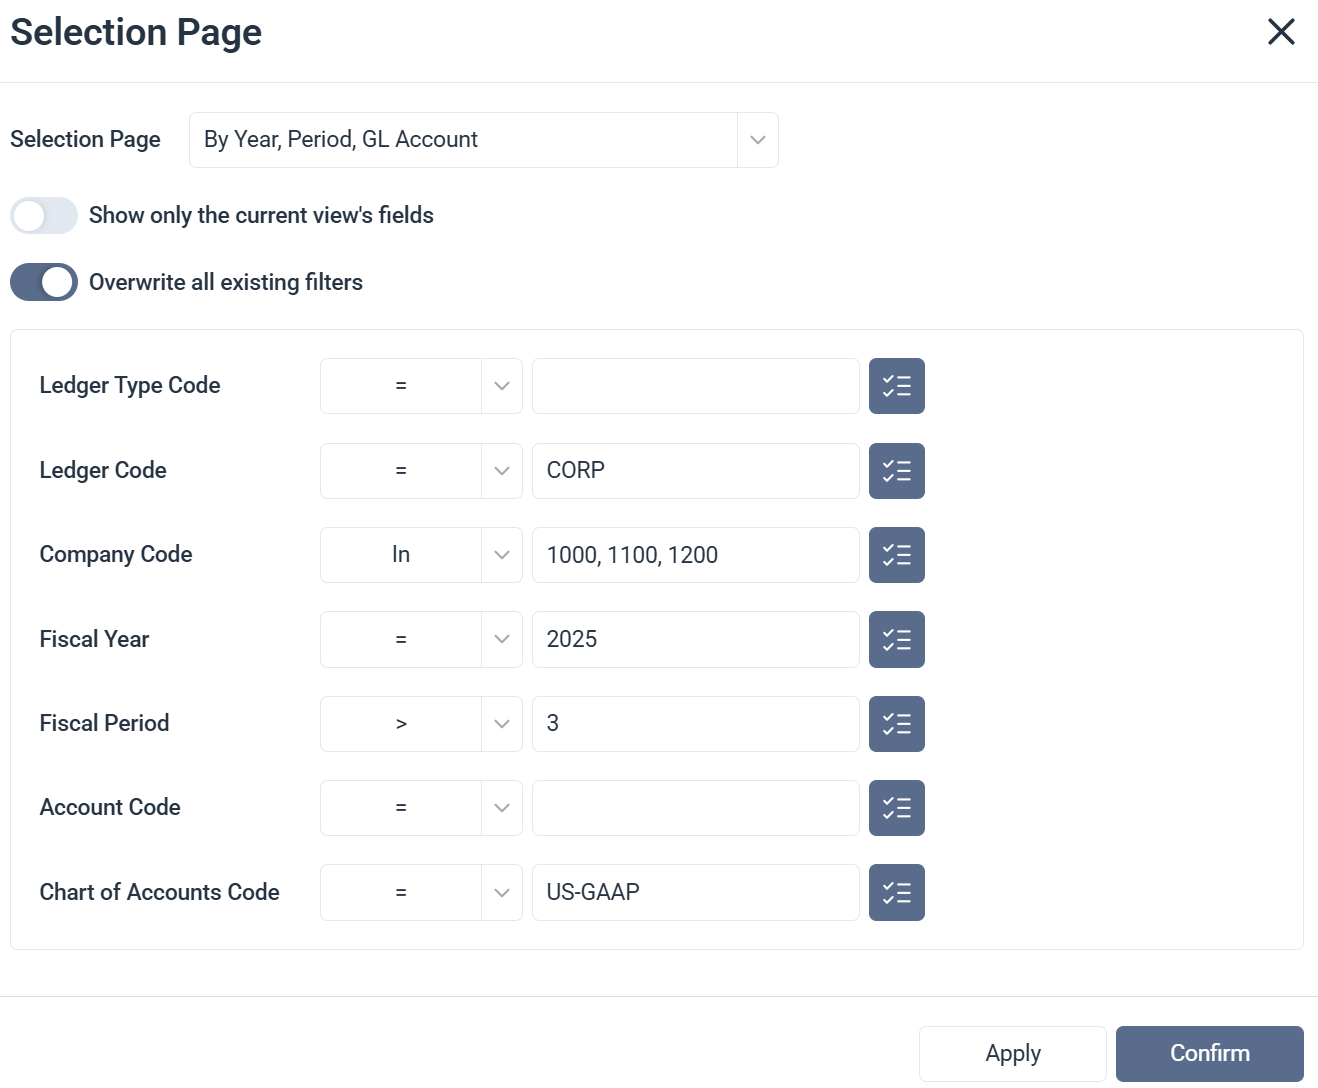
Selection Page dialog options
| Option | What it does |
|---|---|
| Selection Page | Sets which Selection Page the visualization uses. Choose Default to display all fields from the data model. In most cases, use a configured Selection Page for more focused filtering. |
| Show only the current view's fields | Displays only the fields saved in the current visualization. Available for worksheets and charts only. |
| Overwrite all existing filters | Replaces saved filters with the values defined in the Selection Page dialog. |
| Parameters | The fields available to filter the data loaded in the visualization. |
| Operators | Controls how each parameter is evaluated. Supported operators include equal, not equal, greater than, less than, contains, between, in, not in, is null and others. |
| Prompts | Opens a list of available values for the selected parameter. Select the button beside any input field to use it. |
| Confirm | Applies the filters and loads the visualization. |
Update filters after opening
You can reopen the Selection Page at any time after the visualization loads to adjust your filters without closing and reopening the visualization.
- In the Toolbar, select the filter icon and choose Selection Page.
- Update the field values or operators.
- Click Apply to preview or Confirm to apply the changes.
Remove a selection page
Removing a Selection Page means the visualization will load all available data by default the next time it opens. Make sure this is intentional, especially for large datasets where loading without filters can affect performance.