Profit and Loss
On this page:
The Profit and Loss report type is a financial statement that shows a company's revenues, expenses, and net profit or loss over a specific period of time. It is also known as an Income Statement.
Benefits:
-
Financial Performance: Assesses the company's profitability and overall financial health.
-
Trend Analysis: Identifies trends in revenue, expenses, and profitability over time.
-
Decision Making: Provides insights for making informed decisions about pricing, cost management, and business operations.
-
Investor Relations: Helps communicate financial performance to investors and stakeholders.
-
Tax Planning: Assists in tax planning and compliance.
Profit and Loss - Basic
This report includes a classic profit and loss format that includes Month to date and Year to date.
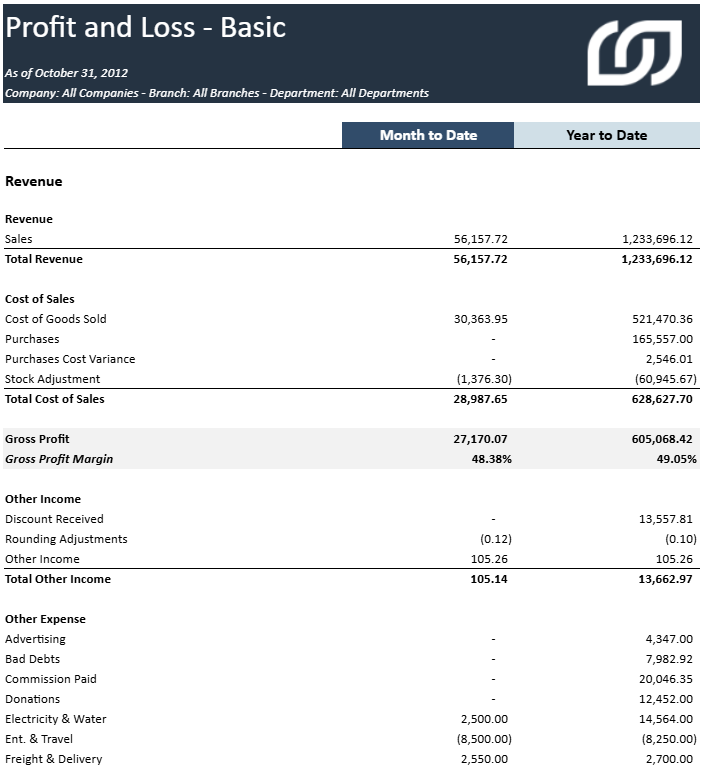
Key metrics at a glance:
-
Month to date: This column shows the financial performance (Ledger Posting) for the current month..
-
Year to Date: This column shows the financial performance (Ledger Posting) for the entire year up to the end of the current month.
Mapping and Filtering
Mapping
All the reports in the Profit & Loss section have the same report structure that can be customized based on the Account Type of Sage 200 Evolution.
| Report Section | Account Type |
| Revenue | 9 |
| Cost of Sales | 10 |
| Other Income | 4 |
| Other Expense | 2 |
Filtering
Selection Page:
-
Company Code
-
Fiscal Year
-
Fiscal Period
-
Branch
-
Department
-
Account Segment 1
-
Account Segment 2
-
Account Segment 3
Profit and Loss - Forecast
Profit and Loss Statement for the full fiscal year (By month) including actuals and forecast.
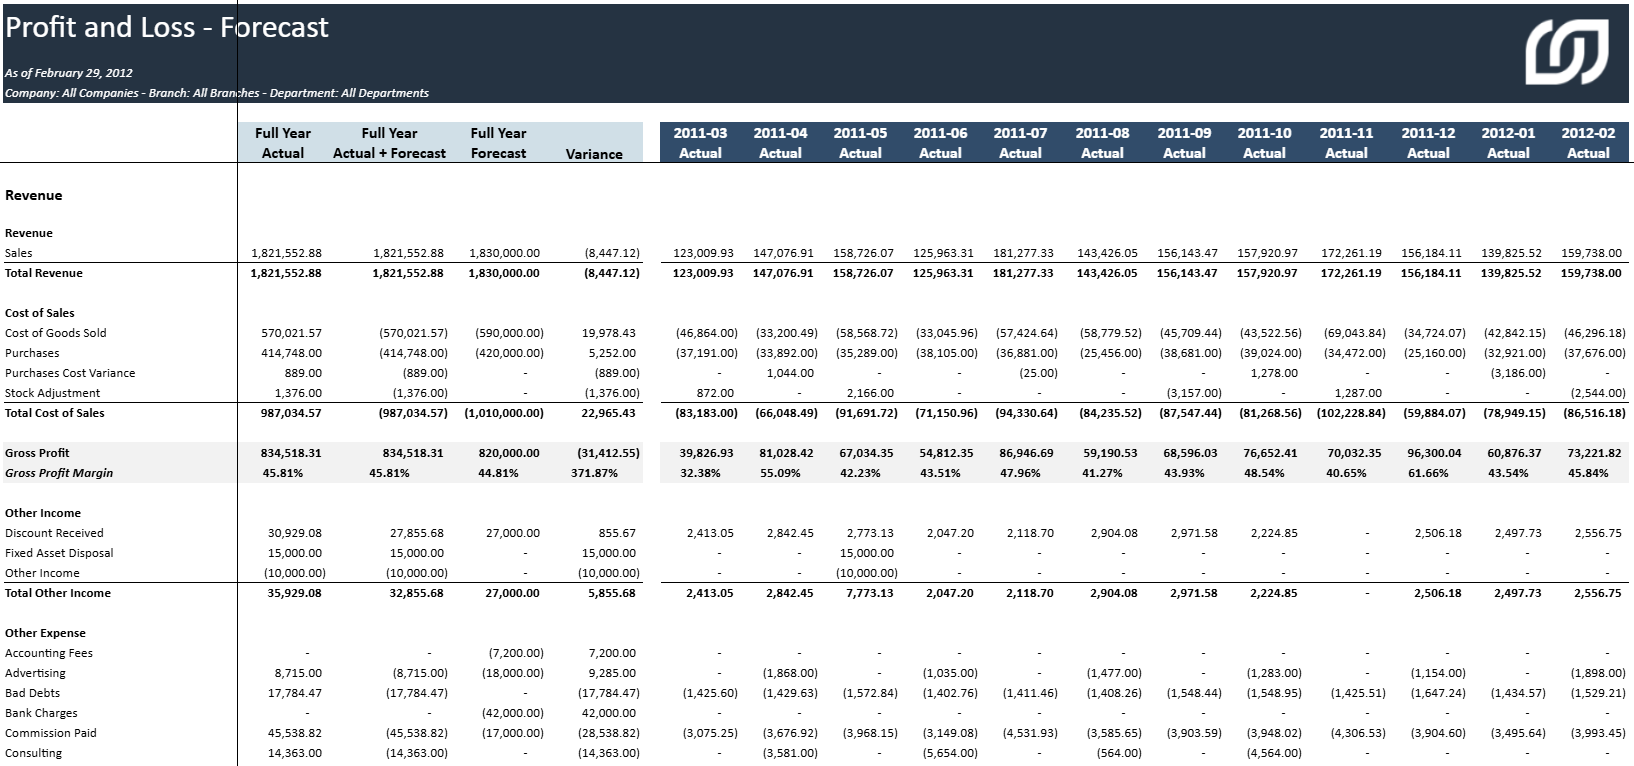
Key metrics at a glance:
-
Full Year Actual: Shows the actual financial performance (Ledger Posting) of each Profit and Loss (P&L) account for the entire year.
-
Full Year Actual + Forecast: Shows the combined actual and forecast financial performance of each P&L account.
-
Full Year Forecast: This column shows the forecast financial performance (Budget) of each P&L account for the entire year.
-
Full Year Variance: This column shows the difference between the actual and forecast financial performance of each P&L account .
Mapping and Filtering
Mapping
All the reports in the Profit & Loss section have the same report structure that can be customized based on the Account Type of Sage 200 Evolution.
| Report Section | Account Type |
| Revenue | 9 |
| Cost of Sales | 10 |
| Other Income | 4 |
| Other Expense | 2 |
Filtering
Selection Page:
-
Company Code
-
Fiscal Year
-
Fiscal Period
-
Branch
-
Department
-
Account Segment 1
-
Account Segment 2
-
Account Segment 3
Profit and Loss - Advanced
This report is a Profit and Loss Statement with more advanced KPIs, including % of Revenues, Budget, and Variances for the current and past year.
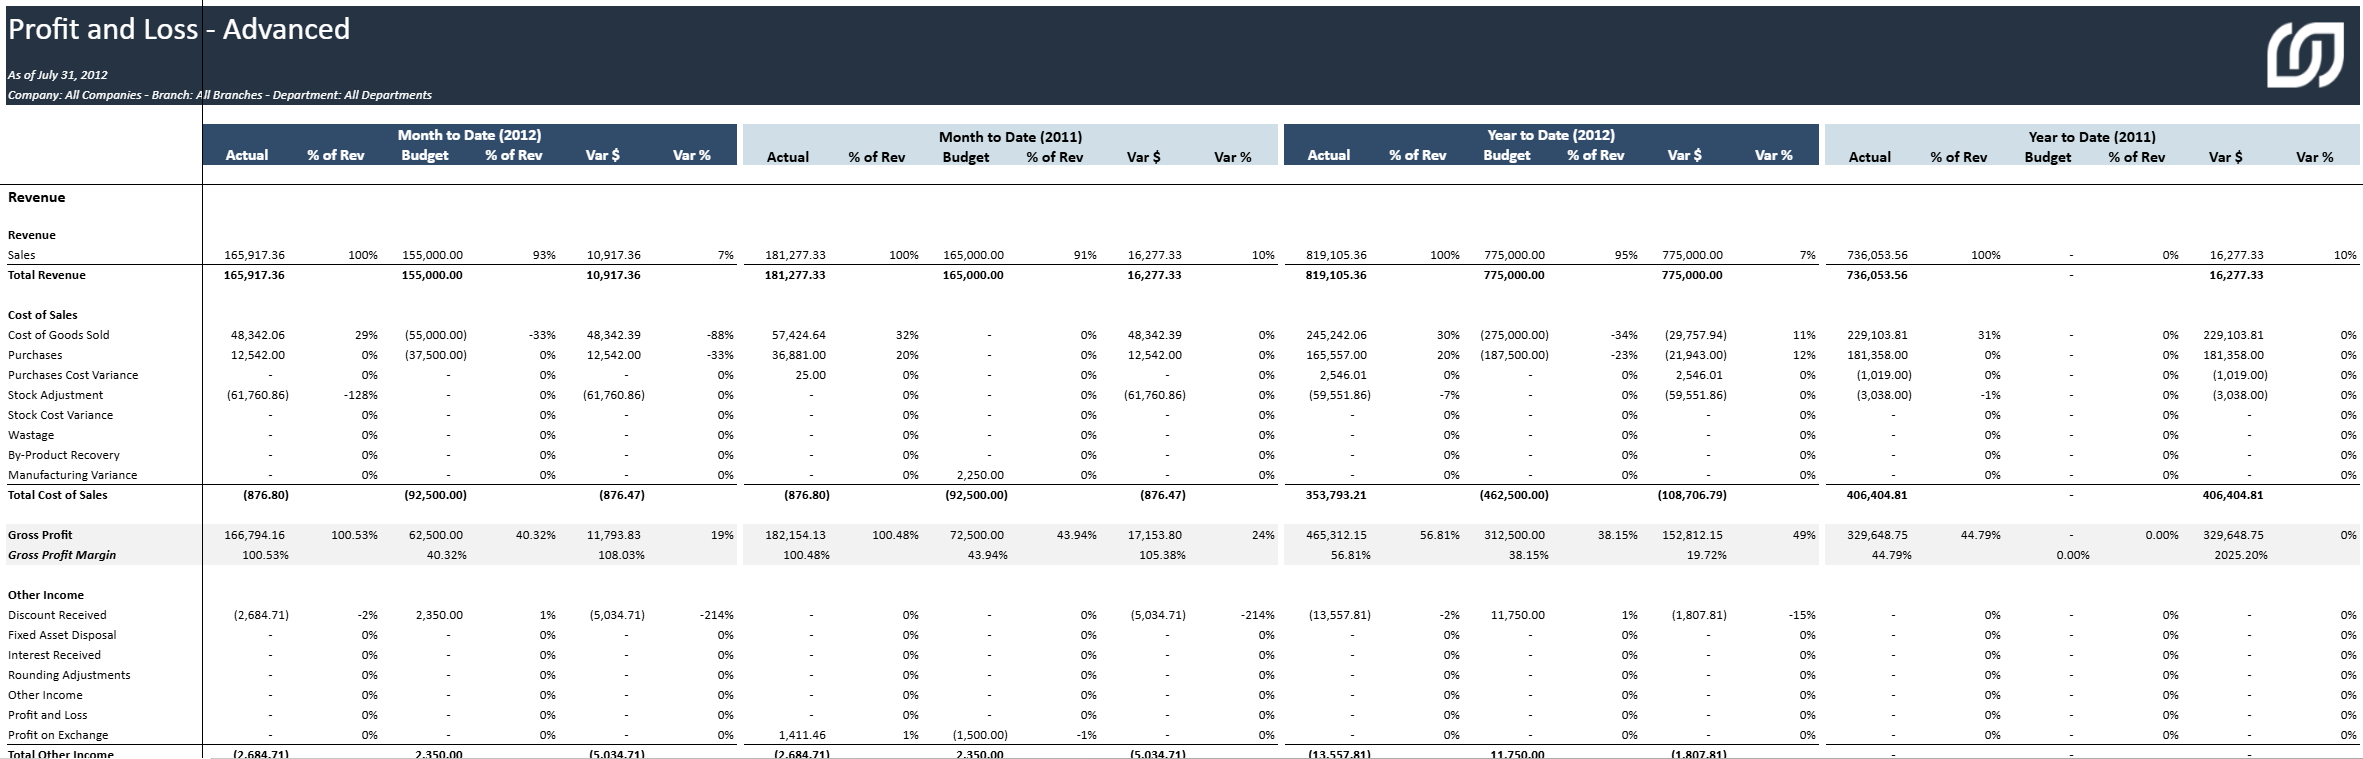
Key metrics at a glance
-
Actual: Shows the actual financial performance (Ledger Posting) of each P&L account for the period being analyzed.
-
% of Rev (Actual): Shows the percentage of total revenue of each P&L account. It is calculated as (Actual / Total Revenues) * 100.
-
Budget: Shows the budgeted financial performance of each P&L account for the period.
-
% of Rev (Budget): Shows the percentage of total revenue of each P&L account. It is calculated as (Budget / Total Revenues) * 100.
-
Var $: Shows the dollar value variance between the actual and budgeted performance of each P&L account .
-
Var %: Shows the percentage variance between the actual and budgeted performance of each P&L account . It is calculated as (Var $ / Budget) * 100.
Mapping and Filtering
Mapping
All the reports in the Profit & Loss section have the same report structure that can be customized based on the Account Type of Sage 200 Evolution.
| Report Section | Account Type |
| Revenue | 9 |
| Cost of Sales | 10 |
| Other Income | 4 |
| Other Expense | 2 |
Filtering
Selection Page:
-
Company Code
-
Fiscal Year
-
Fiscal Period
-
Branch
-
Department
-
Account Segment 1
-
Account Segment 2
-
Account Segment 3
Profit and Loss - Yearly Comparison
The Profit and Loss - Yearly Comparison report is a Profit and Loss Statement with a current month section and a year to date section that compares current and past year.
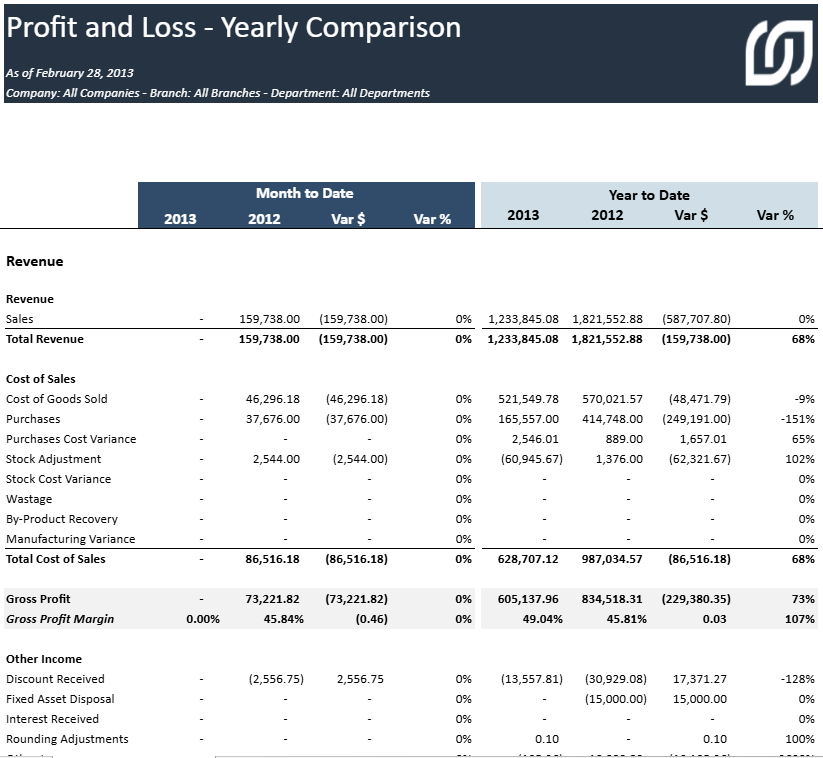
Key metrics at a glance:
-
Current Year: This column shows the actual financial performance (Ledger Posting) of each P&L account for the current period.
-
Last Year: This column shows the actual financial performance (Ledger Posting) of each P&L account for last year's same period.
-
%: This column shows the variance in percentage from the current period compared to last year's same period. It is calculated as (Current Year Period - Last Year Period / Current Year Period) * 100.
Mapping and Filtering
Mapping
All the reports in the Profit & Loss section have the same report structure that can be customized based on the Account Type of Sage 200 Evolution.
| Report Section | Account Type |
| Revenue | 9 |
| Cost of Sales | 10 |
| Other Income | 4 |
| Other Expense | 2 |
Filtering
Selection Page:
-
Company Code
-
Fiscal Year
-
Fiscal Period
-
Branch
-
Department
-
Account Segment 1
-
Account Segment 2
-
Account Segment 3
Profit and Loss - Actual vs. Budget
The report is a Profit and Loss Statement with a month to date section and a year to date section that compares Actual vs Budget.

Key metrics at a glance:
-
Actual: This column shows the actual financial performance (Ledger Posting) of each P&L account for the period being analyzed. .
-
Budget: This column shows the budgeted financial performance of each P&L account for the period.
-
%: This column shows the variance in percentage for the actual vs budget. It is calculated as (Actual / Budget) * 100.
Mapping and Filtering
Mapping
All the reports in the Profit & Loss section have the same report structure that can be customized based on the Account Type of Sage 200 Evolution.
| Report Section | Account Type |
| Revenue | 9 |
| Cost of Sales | 10 |
| Other Income | 4 |
| Other Expense | 2 |
Filtering
Selection Page:
-
Company Code
-
Fiscal Year
-
Fiscal Period
-
Branch
-
Department
-
Account Segment 1
-
Account Segment 2
-
Account Segment 3
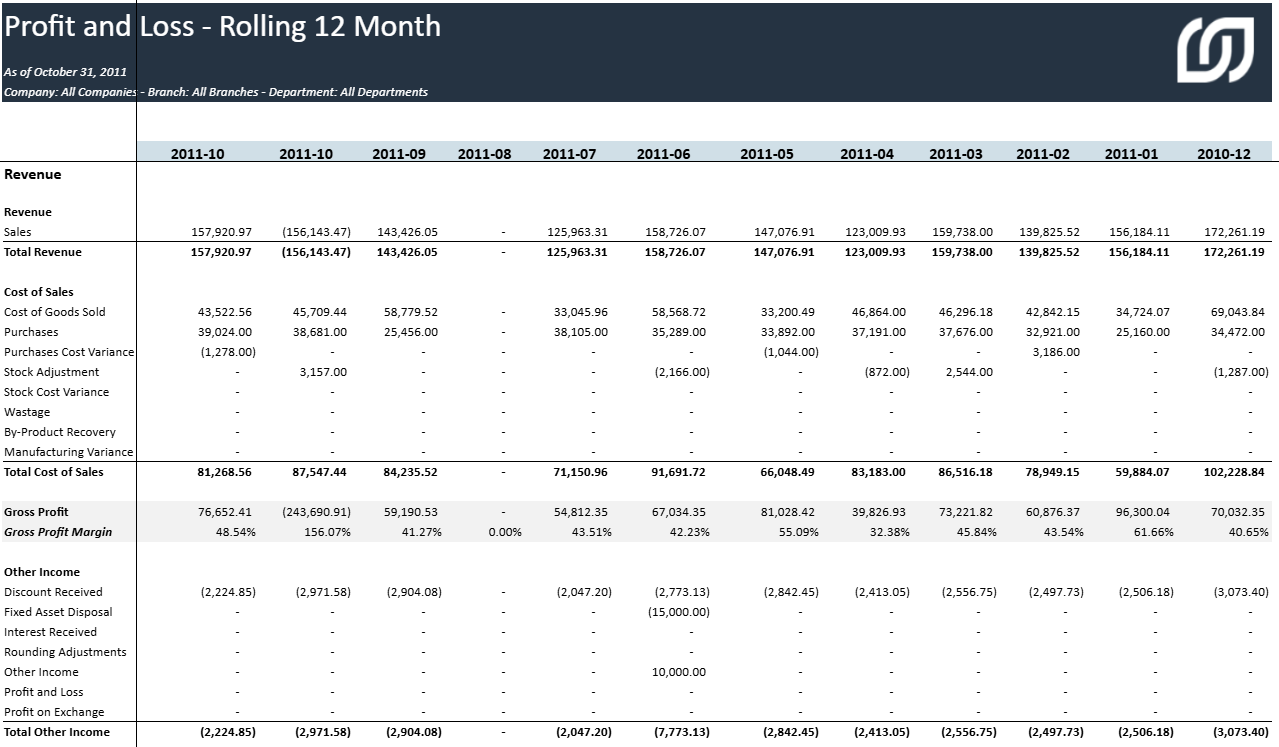
Profit and Loss - Rolling 12 Month
This is a report with a Profit and Loss Statement for the last 12 months (from the selected period), showcasing the financial performance (Ledger Posting) of each P&L account. It is also called a Trailing 12 months (TTM) report.
Key metrics at a glance:
-
YYYYMM: This column shows the Ledger Posting of each P&L account for the period.
Mapping and Filtering
Mapping
All the reports in the Profit & Loss section have the same report structure that can be customized based on the Account Type of Sage 200 Evolution.
| Report Section | Account Type |
| Revenue | 9 |
| Cost of Sales | 10 |
| Other Income | 4 |
| Other Expense | 2 |
Filtering
Selection Page:
-
Company Code
-
Fiscal Year
-
Fiscal Period
-
Branch
-
Department
-
Account Segment 1
-
Account Segment 2
-
Account Segment 3
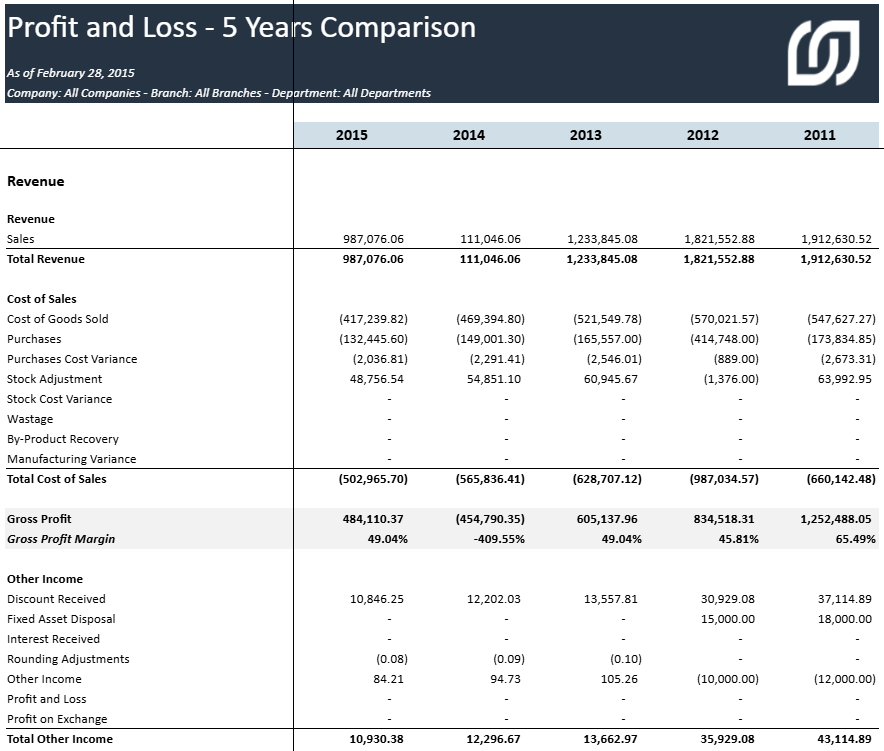
Profit and Loss - 5 Years Comparison
This report is a Profit and Loss Statement for the last 5 years from the selection.
Key metrics at a glance:
-
Year: This column shows the Ledger Posting of each P&L account for the period.
Mapping and Filtering
Mapping
All the reports in the Profit & Loss section have the same report structure that can be customized based on the Account Type of Sage 200 Evolution.
| Report Section | Account Type |
| Revenue | 9 |
| Cost of Sales | 10 |
| Other Income | 4 |
| Other Expense | 2 |
Filtering
Selection Page:
-
Company Code
-
Fiscal Year
-
Fiscal Period
-
Branch
-
Department
-
Account Segment 1
-
Account Segment 2
-
Account Segment 3
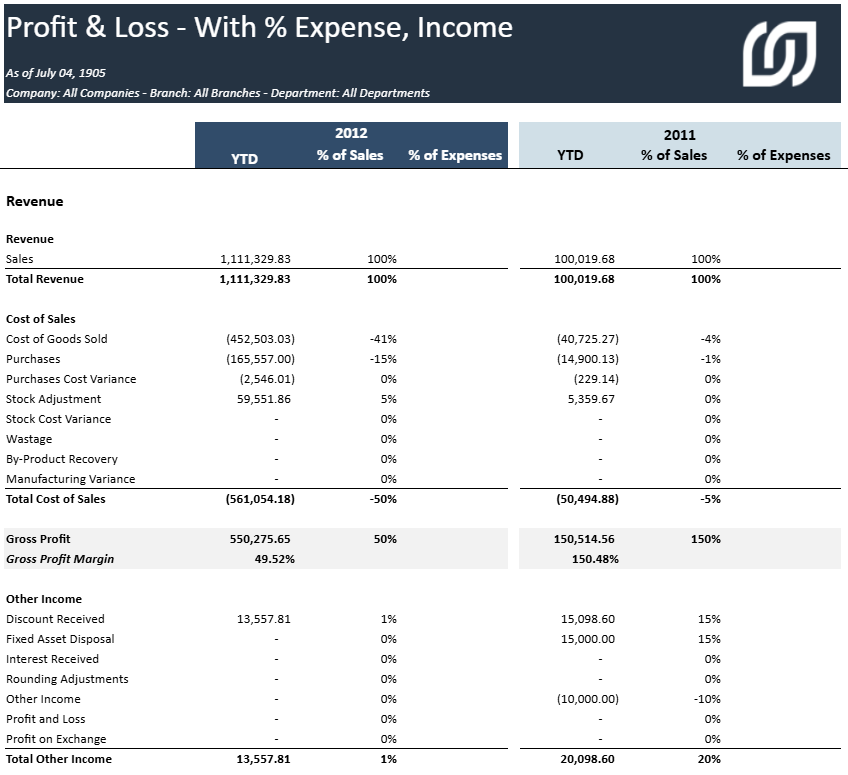
Profit and Loss - With % Expense, Income
This report is a Profit and Loss Statement that includes a year to date, % of sales, and % of expenses for the selected period and the previous year's selected period.
Key metrics at a glance:
-
Year to Date (YTD): Shows the financial performance (Ledger Posting) for the entire year up to the end of the current month.
-
% of Sales: Shows the percentage of total revenue that each P&L account represents. It is calculated as (YTD / Total Sales) * 100.
-
% of Expenses: Shows the percentage of total expenses that each P&L account represents. It is calculated as (YTD / Total Expenses) * 100.
Mapping and Filtering
Mapping
All the reports in the Profit & Loss section have the same report structure that can be customized based on the Account Type of Sage 200 Evolution.
| Report Section | Account Type |
| Revenue | 9 |
| Cost of Sales | 10 |
| Other Income | 4 |
| Other Expense | 2 |
Filtering
Selection Page:
-
Company Code
-
Fiscal Year
-
Fiscal Period
-
Branch
-
Department
-
Account Segment 1
-
Account Segment 2
-
Account Segment 3