Executive Sales Summary - TY vs LY
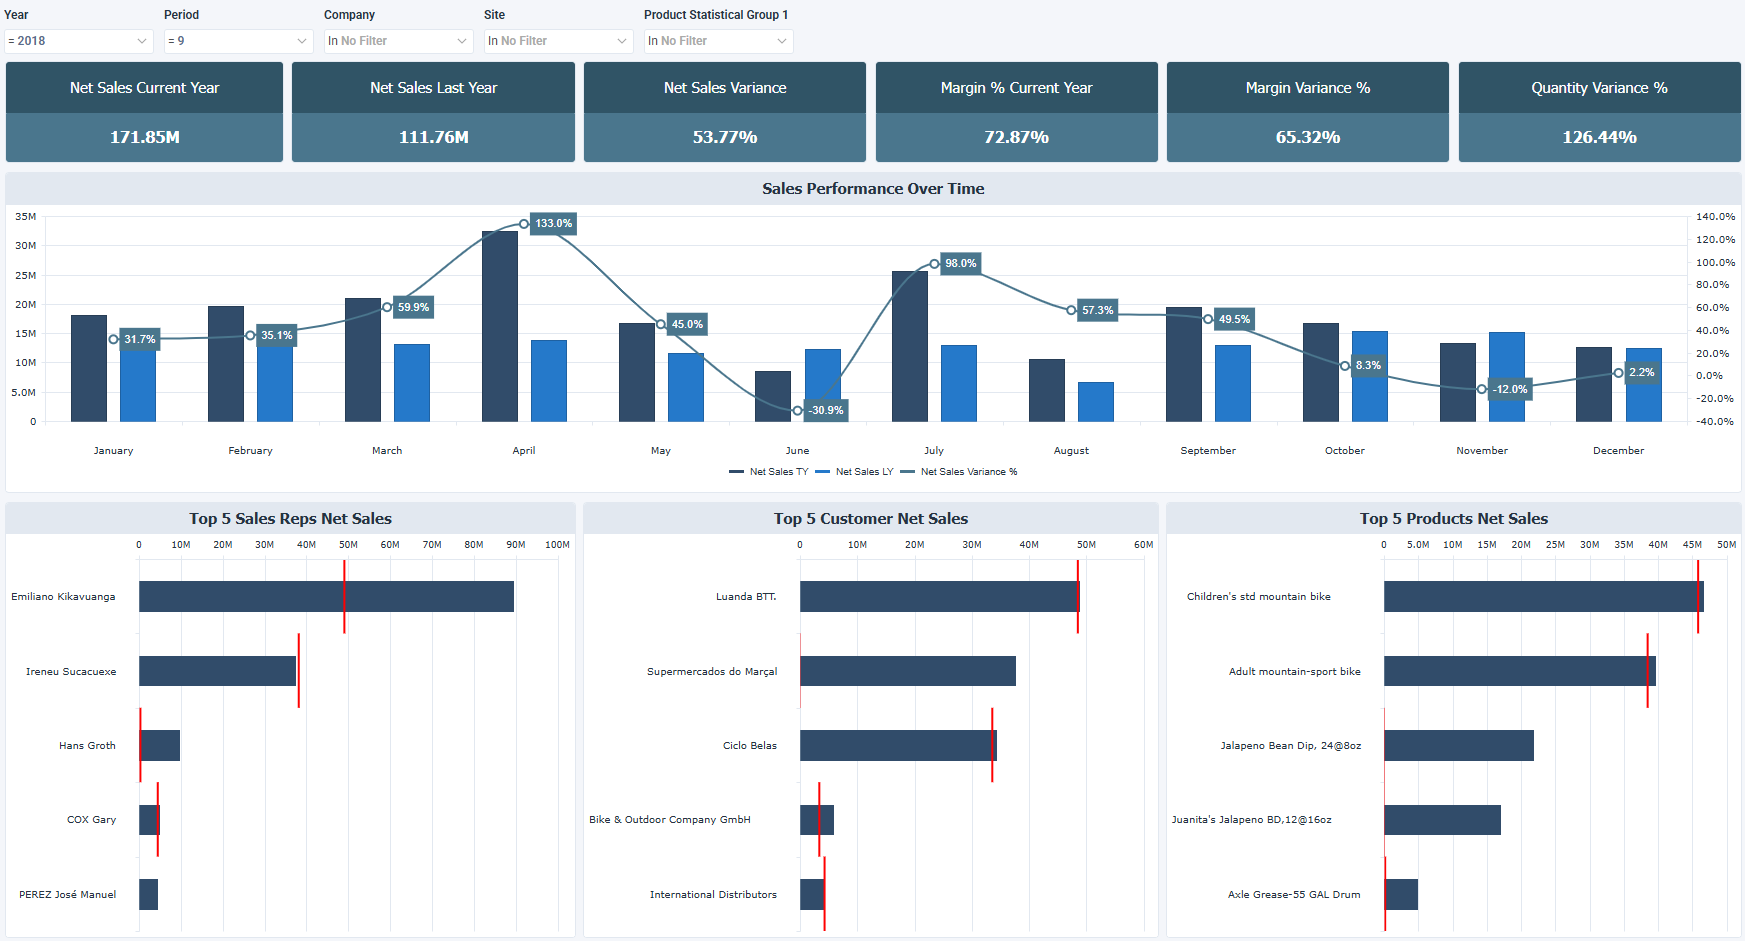
The Executive Sales Summary - TY vs LY dashboard for Sage X3 compares net sales, margin, and quantity between this year and last year, broken down by period, sales representative, customer, and product. It helps executive leadership track how revenue and margin are trending and identify which sales reps, customers, and products drive the most current year sales.
How to use the executive sales summary dashboard
- Compare net sales year over year to see if revenue is growing or declining overall.
- Pinpoint margin and quantity variance to see whether changes in sales come from pricing, volume, or both.
- Review sales performance by period to identify which months are ahead or behind last year.
- Rank top contributors across sales reps, customers, and products by current year net sales.
Filters
Use the filtering panel at the top of the Executive Sales Summary (TY vs LY) dashboard to control which data is shown. The filters apply to all views and ensure the dashboard reflects the selections you choose.
Key performance indicators (KPIs)
The key performance indicators (KPIs) are displayed at the top of the dashboard. They show a year over year summary of net sales, margin, and quantity, and update based on the filters you apply.
| KPI | What it measures |
|---|---|
| Net Sales Current Year | Total net sales for the current year. |
| Net Sales Last Year | Total net sales for the same period last year, used as the comparison baseline. |
| Net Sales Variance | Difference between this year and last year net sales, showing the absolute change in revenue. |
| Margin % Current Year | Current year gross margin as a percentage of net sales. |
| Margin Variance % | Year over year change in margin %, indicating whether profitability is improving or declining. |
| Quantity Variance % | Year over year change in quantity sold, showing whether volume is increasing or decreasing. |
Visual components
| View name | Type of view | What it shows |
|---|---|---|
| Sales Performance Over Time | Combination | Plots net sales TY and LY by period with net sales variance % overlaid, showing both absolute performance and the rate of year over year change. |
| Top 5 Sales Reps Net Sales | Horizontal Bullet | Ranks the top 5 sales reps by current year net sales, with last year as a reference line to show individual year over year change. |
| Top 5 Customer Net Sales | Horizontal Bullet | Ranks the top 5 customers by current year net sales, with last year as a reference line to show account level year over year change. |
| Top 5 Products Net Sales | Horizontal Bullet | Ranks the top 5 products by current year net sales, with last year as a reference line to show product level year over year change. |