Finance CFO
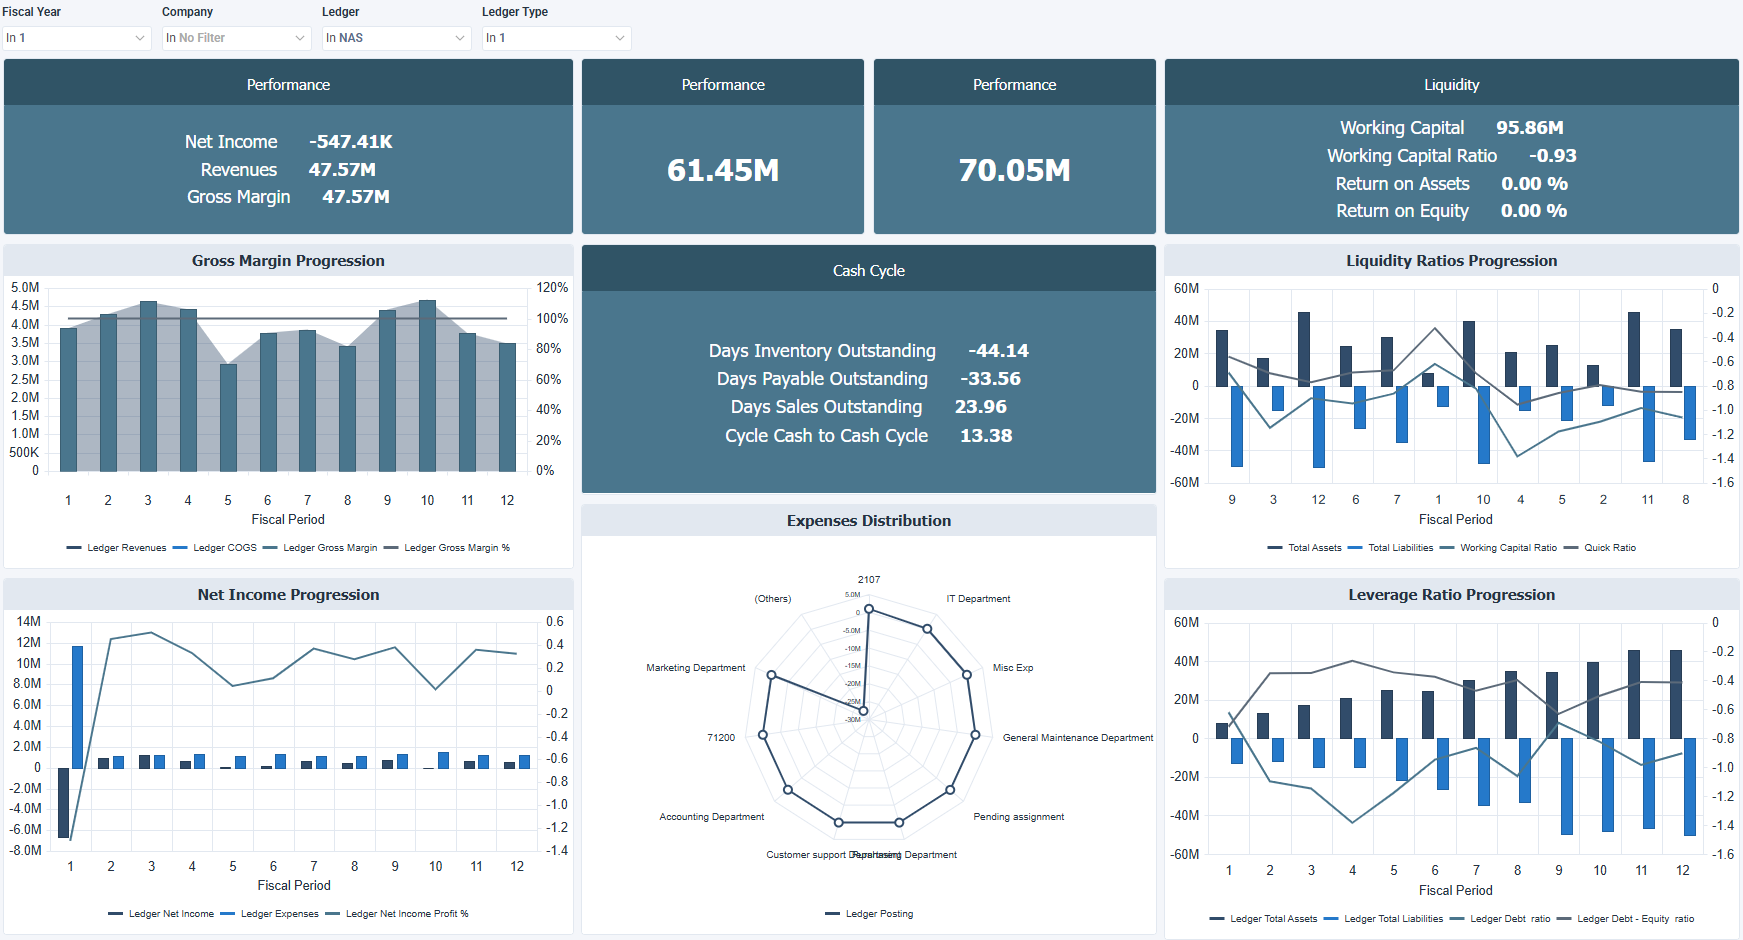
The Finance CFO dashboard for Sage X3 ties together net income, revenue, and margin with liquidity ratios and the cash conversion cycle. It helps CFOs and finance teams see how profitable the business is, how easily it covers short term obligations, and how long cash stays tied up before it's collected.
How to use the finance CFO dashboard
- Trace net income and gross margin by fiscal period to see how profitability is trending.
- Read liquidity and return ratios to see how well the business covers obligations and uses capital.
- Break down the cash conversion cycle using days inventory, payable, and sales outstanding to see how quickly cash comes back.
- Sort expense categories by department to see where spending concentrates.
Filters
Use the filtering panel at the top of the Finance CFO dashboard to control which data is shown. The filters apply to all views and ensure the dashboard reflects the selections you choose.
Fiscal Year: multiple values
Company: multiple values
Ledger: multiple values
Ledger Type: multiple values
Key performance indicators (KPIs)
The key performance indicators (KPIs) are displayed at the top of the dashboard. They show performance, liquidity, and cash cycle measures, and update based on the filters you apply.
Performance KPIs
| KPI | What it measures |
|---|---|
| Net Income | Profit or loss after deducting all expenses, taxes, and costs from revenue. A positive value indicates profitability, while a negative value indicates a loss. |
| Revenues | Total income from sales of goods and services before expenses. Indicates top-line performance. |
| Gross Margin | Margin percentage after subtracting cost of goods sold from revenue. Higher values indicate stronger profitability from core operations. |
Liquidity KPIs
| KPI | What it measures |
|---|---|
| Working Capital | Difference between current assets and current liabilities. Indicates short-term liquidity. |
| Working Capital Ratio | Liquidity ratio calculated as current assets divided by current liabilities. Indicates the ability to cover short-term obligations. |
| Return on Assets | Profitability ratio measuring net income relative to total assets. Indicates how effectively assets generate profit. |
| Return on Equity | Profitability ratio measuring net income relative to shareholders' equity. Indicates return generated for investors. |
Cash Cycle KPIs
| KPI | What it measures |
|---|---|
| Days Inventory Outstanding | Average number of days inventory is held before sale. Indicates inventory turnover efficiency. |
| Days Payable Outstanding | Average number of days to pay suppliers. Indicates payment timing and working capital management. |
| Days Sales Outstanding | Average number of days to collect receivables. Indicates collection efficiency and cash conversion speed. |
| Cash to Cash Cycle | Number of days required to convert inventory and other inputs into cash from sales. Indicates cash conversion efficiency. |
Visual components
| View name | Type of view | What it shows |
|---|---|---|
| Gross Margin Progression | Combination | Plots revenue, COGS, gross margin, and gross margin % by fiscal period. |
| Liquidity Ratios Progressions | Combination | Plots total assets, total liabilities, working capital ratio, and quick ratio by fiscal period. |
| Net Income Progression | Combination | Plots net income, expenses, and net income margin % by fiscal period. |
| Expenses Distribution | Radar Line | Shows expense posting by department and account category. |
| Leverage Ratio Progression | Combination | Plots total assets, total liabilities, debt ratio, and debt to equity ratio by fiscal period. |