Terminations
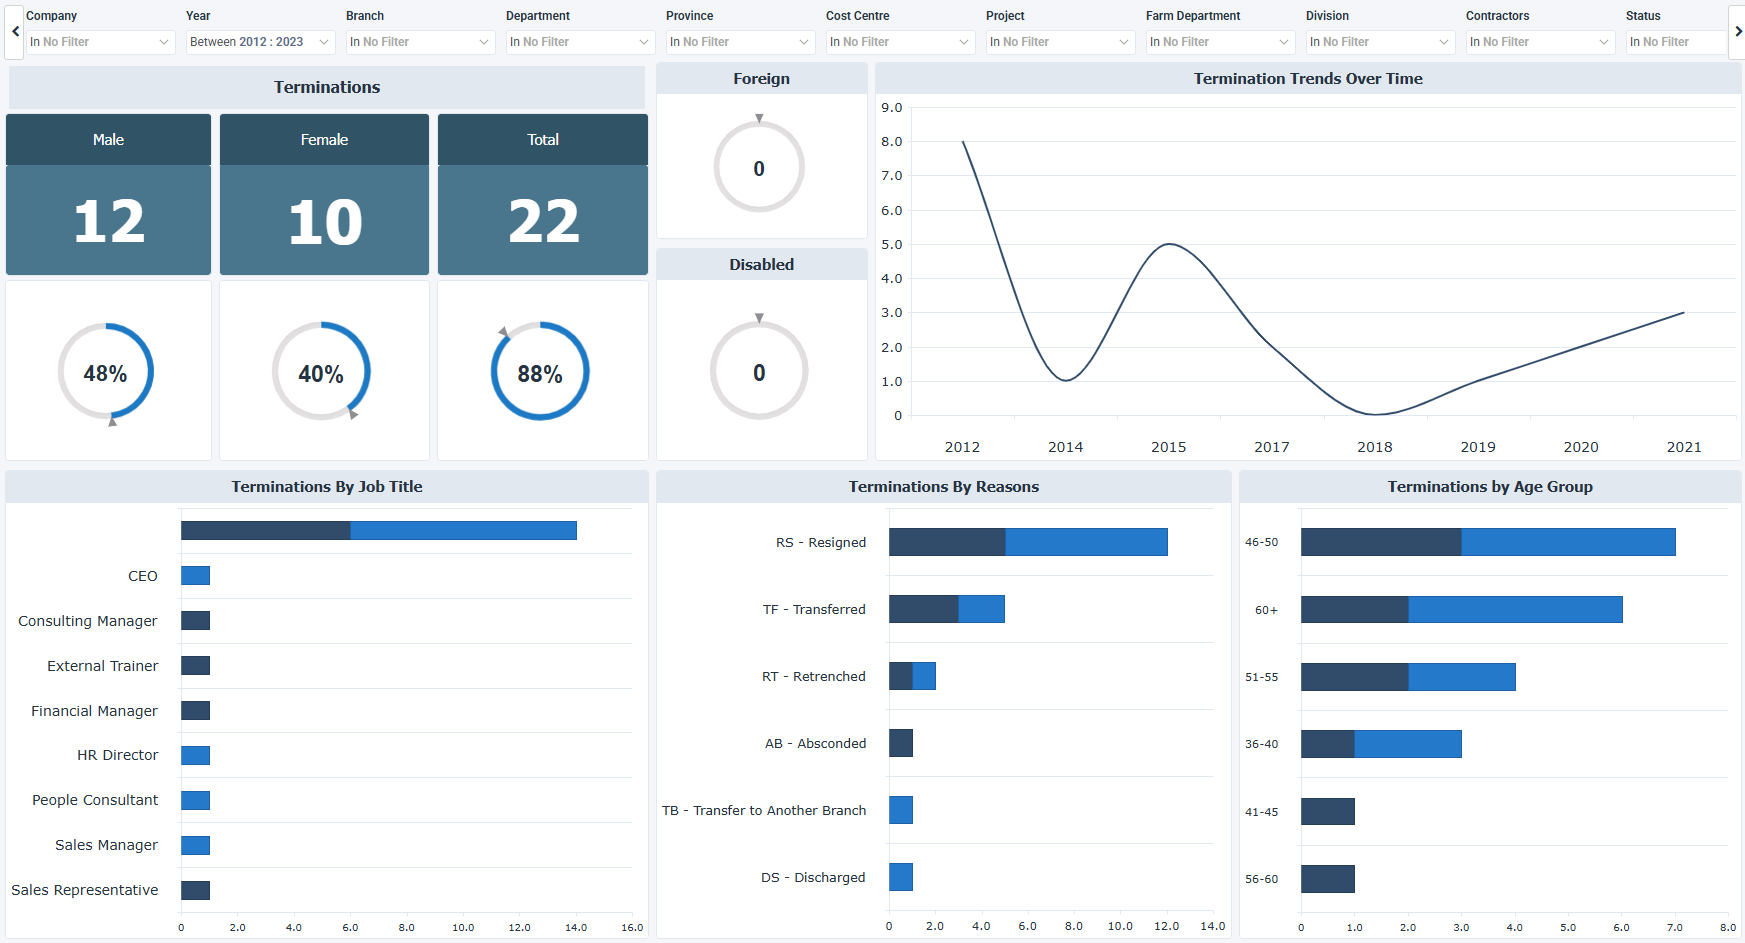
The Terminations dashboard for Sage 300 People counts employee terminations by gender, job role, age group, and termination reason over time. It includes attrition patterns, structural risk, the reasons employees leave, and workforce stability and retention.
How to use the terminations dashboard
- Follow employee turnover through the number of terminations in the selected period.
- Compare male and female terminations to see how exits split between genders.
- List the reasons employees left, such as resigned, transferred, retrenched, absconded, or discharged.
- Compare terminations by age group and job title to find where most exits occur.
- Look at termination trends over the years to see how restructuring affects the number of exits.
Filters
Use the filtering panel at the top of the Terminations dashboard to control which data is shown. The filters apply to all views and ensure the dashboard reflects the selections you choose.
The filters from Branch to TWK Costing work as a hierarchy: a selection in one limits the values listed in the filters that come after it.
The list below may not match what you see in your own filters. Sage lets each company name and order these hierarchy filters on its own, so Branch through TWK Costing is only one possible example.
Key performance indicators (KPIs)
The key performance indicators (KPIs) at the top of the dashboard show the male, female, and total terminations, each with a termination percentage, and update based on the filters you apply.
| KPI | What it measures |
|---|---|
| Male Terminations | Number of male employees who left in the selected period, with the percentage showing their part of the overall termination rate. |
| Female Terminations | Number of female employees who left in the selected period, with the percentage showing their part of the overall termination rate. |
| Total Terminations | Number of employees who left in the selected period, with the percentage showing the overall termination rate. |
Visual components
| View name | Type of view | What it shows |
|---|---|---|
| Foreign Terminations | Simple Gauge | Counts the terminated employees classified as foreign nationals. Higher values mean more turnover in this segment, and lower values mean less. |
| Disabled Terminations | Simple Gauge | Reports the number of terminated employees registered with a disability status. Higher values may point to accommodation or inclusion challenges, and lower values may point to stronger retention. |
| Termination Trends Over Time | Spline | Follows the number of terminations each year to show rises and drops in turnover over time. |
| Terminations by Job Title | Stacked Bar | Splits the number of terminations in each job title by gender, with one bar for each job title. |
| Terminations by Reasons | Stacked Bar | Breaks down the terminations by reason code, such as resigned, transferred, retrenched, absconded, transferred to another branch, and discharged. |
| Terminations by Age Group | Stacked Bar | Groups the terminations by age range. |