Performance
The Performance dashboard for Sage 300 People measures performance review coverage, rating distribution, calibration consistency, and top performers. It includes review completion, performance outcomes, calibration gaps, and the employees who have no review.
How to use the performance dashboard
- Check review completion through the number of reviews and the percentage of employees reviewed.
- Read how ratings and scores are distributed across the reviewed employees.
- Compare the review average score with the calibrated score to find calibration gaps by year.
- List the top performers ranked by review average score.
- Count the employees with no review to see where reviews are missing.
Filters
Use the filtering panel at the top of the Performance dashboard to control which data is shown. The filters apply to all views and ensure the dashboard reflects the selections you choose.
The filters from Company to TWK Costing work as a hierarchy: a selection in one limits the values listed in the filters that come after it.
The list below may not match what you see in your own filters. Sage lets each company name and order these hierarchy filters on its own, so Company through TWK Costing is only one possible example.
Key performance indicators (KPIs)
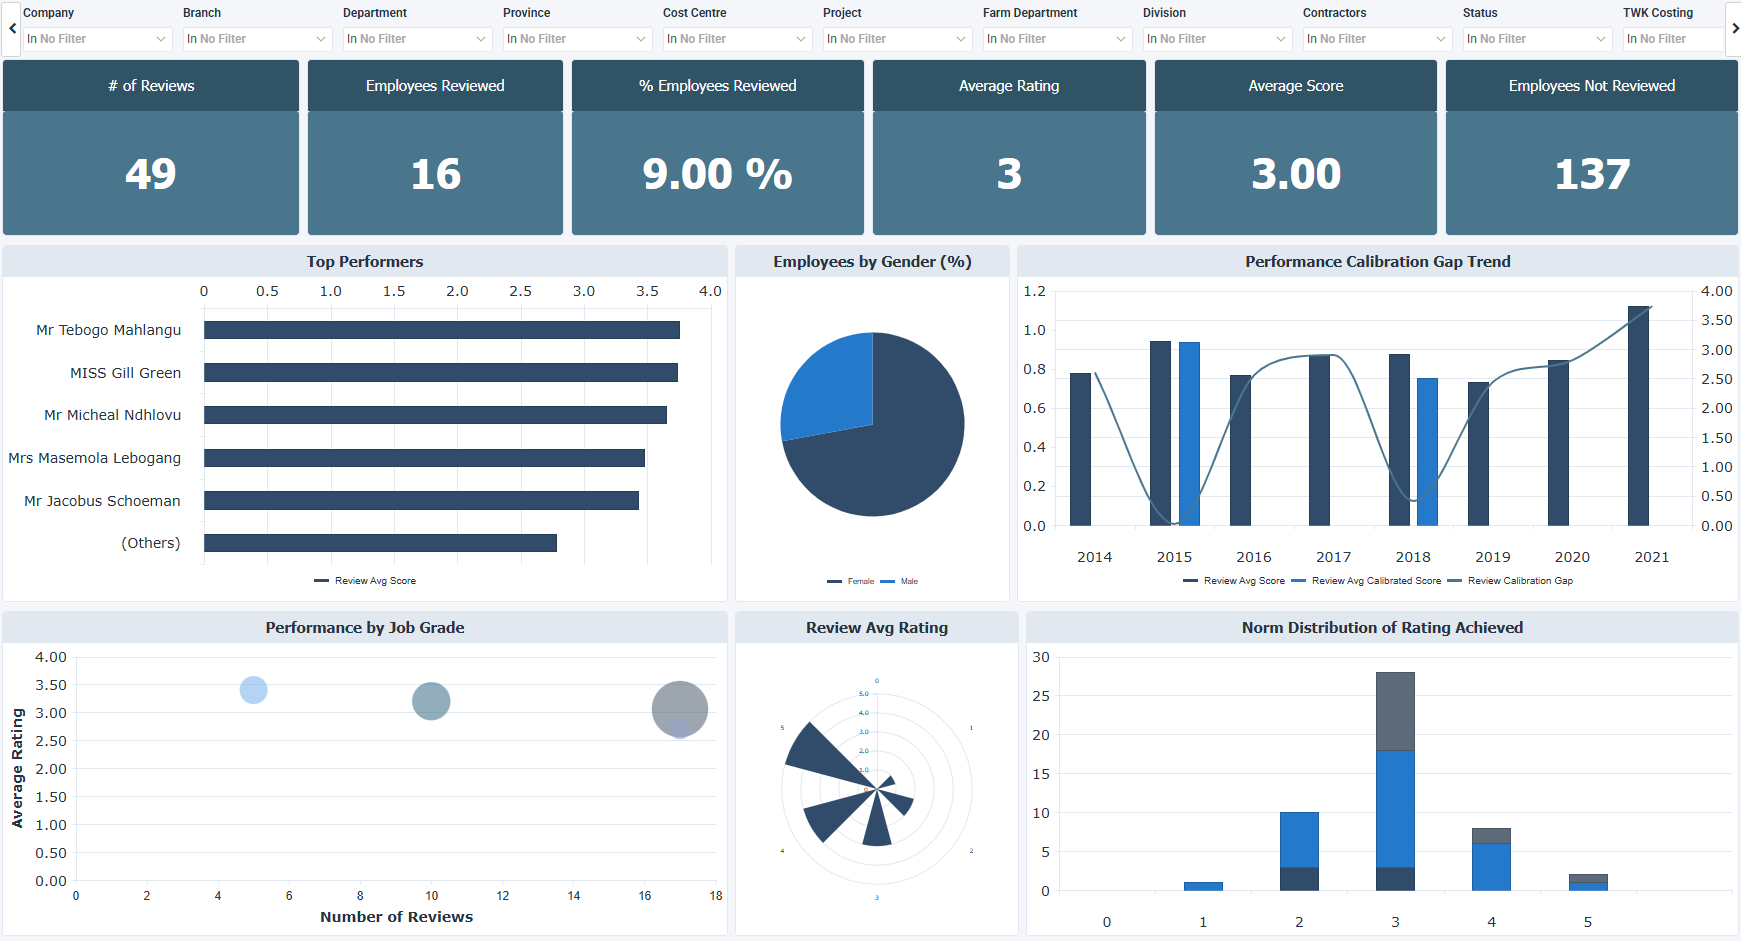
The key performance indicators (KPIs) at the top of the dashboard show six performance review measures, and update based on the filters you apply.
| KPI | What it measures |
|---|---|
| Number of Reviews | Total count of completed performance reviews within the selected filters. Higher values point to broader participation, and lower values point to more limited review coverage. |
| Employees Reviewed | Number of distinct employees with at least one performance review. Higher values mean more of the workforce was reviewed, and lower values mean fewer employees were. |
| % of Employees Reviewed | Percentage of the workforce that has been formally reviewed. Higher percentages mean more complete review coverage, and lower percentages point to gaps in review completion. |
| Average Rating | Mean rating across completed reviews. Higher values mean employees were rated higher on average, and lower values may point to development needs. |
| Average Score | Average calibrated performance score across reviewed employees. Higher values mean higher calibrated scores, and lower values mean lower ones. |
| Employees Not Reviewed | Number of active employees without a performance review. Higher values mean more employees have no review on record, and lower values mean fewer. |
Visual components
| View name | Type of view | What it shows |
|---|---|---|
| Top Performers | Horizontal Bar | Ranks employees by review average score, with the top five listed individually and the remaining employees grouped as (Others). |
| Employees by Gender | Pie | Splits employees by gender as a percentage, with one slice for female and one for male. |
| Performance Calibration Gap Trend | Combination | Follows the review average score and the review average calibrated score by year, with the review calibration gap as a line. |
| Performance by Job Grade | Bubble | Compares job grades by number of reviews (horizontal axis) against average rating (vertical axis). |
| Review Avg Rating | Radar Column | Displays the review average rating on a circular chart, with one wedge for each rating value around the edge. |
| Norm Distribution of Rating Achieved | Stacked Bar | Groups the results by rating achieved to show how ratings are distributed. |