Sales
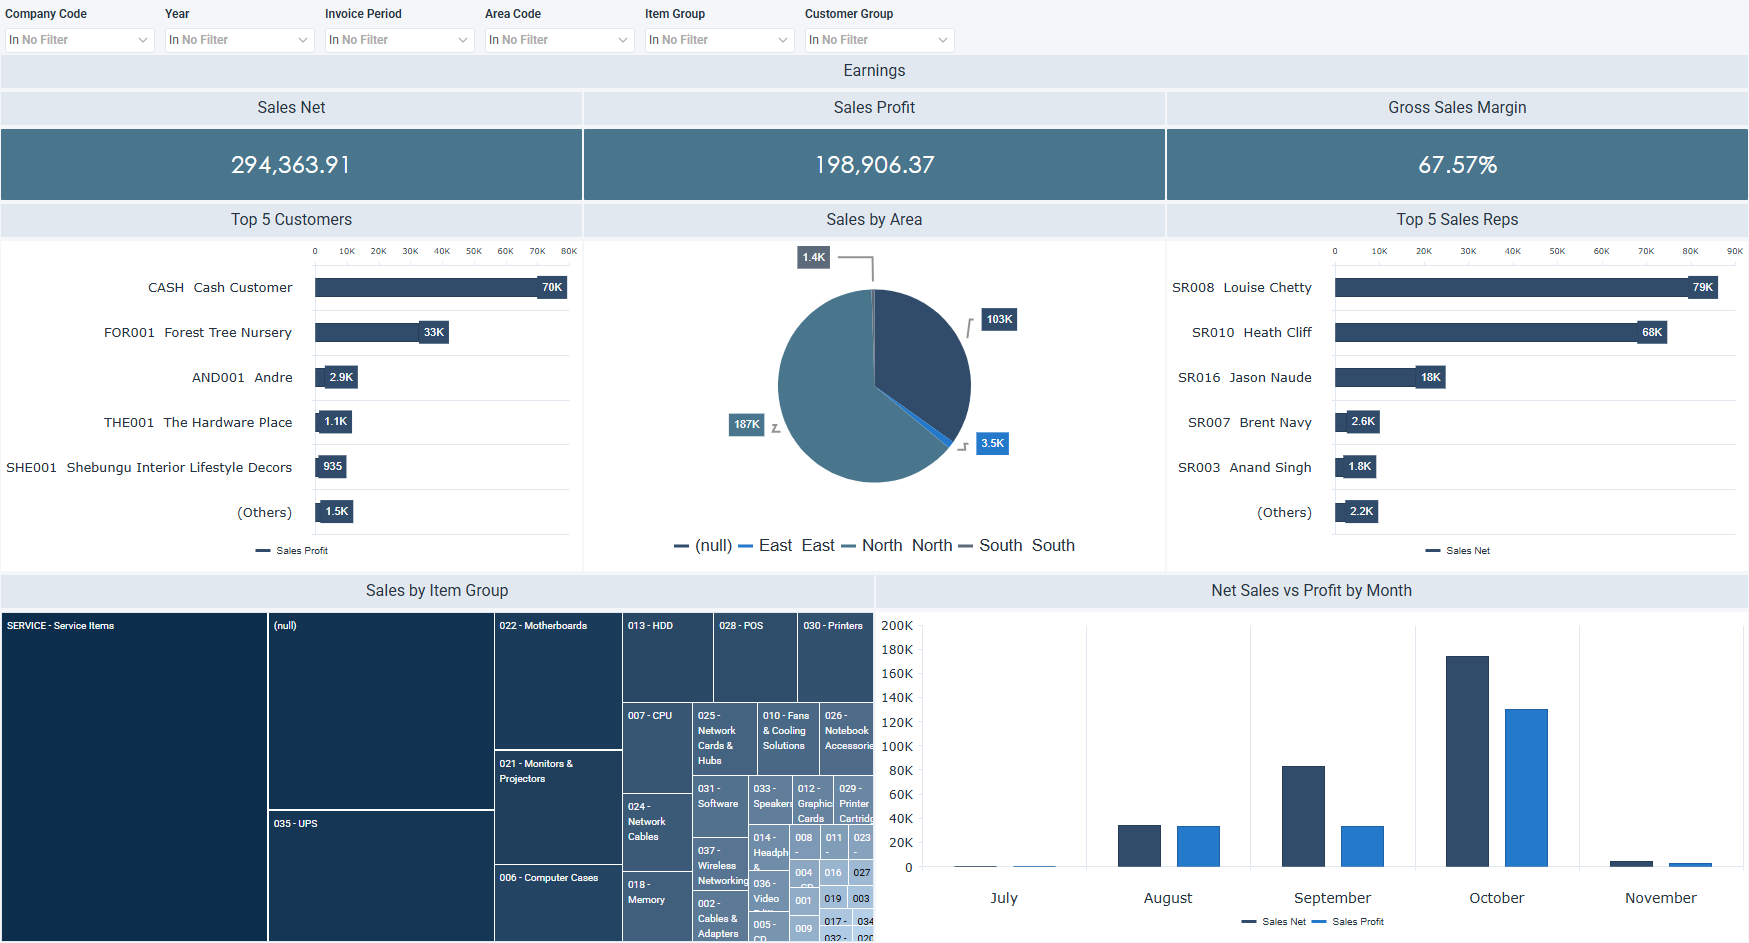
The Sales dashboard for Sage 200 Evolution reports sales performance, customer trends, and regional distribution. It includes net sales, profit, and margin, alongside the top customers, sales reps, and item groups by revenue.
How to use the sales dashboard
- Follow total sales, profit, and gross margin together for the selected period.
- Rank the top customers by revenue and the top sales reps by total sales.
- Compare sales across locations and product categories to see where revenue concentrates.
- Follow monthly sales and profit patterns to spot trends over time.
Filters
Use the filtering panel at the top of the Sales dashboard to control which data is shown. The filters apply to all views and ensure the dashboard reflects the selections you choose.
Company Code: multiple values
Year: multiple values
Invoice Period: multiple values
Area Code: multiple values
Item Group: multiple values
Customer Group: multiple values
Key performance indicators (KPIs)
The key performance indicators (KPIs) at the top of the dashboard show net sales, profit, and gross margin, and update based on the filters you apply.
| KPI | What it measures |
|---|---|
| Sales Net | Total revenue generated from sales. |
| Sales Profit | Net profit after deducting costs. |
| Gross Sales Margin | Percentage of revenue retained as profit. |
Visual components
| View name | Type of view | What it shows |
|---|---|---|
| Top 5 Customers | Horizontal Bar | Ranks the top 5 customers by sales revenue. |
| Sales by Area | Pie | Splits sales by area. |
| Top 5 Sales Reps | Horizontal Bar | Ranks sales representatives by total sales. |
| Sales by Item Group | Tree Map | Displays sales by item group. |
| Net Sales vs Profit by Month | Vertical Bar | Compares net sales and profit by month. |