Sales Anomalies and Trends
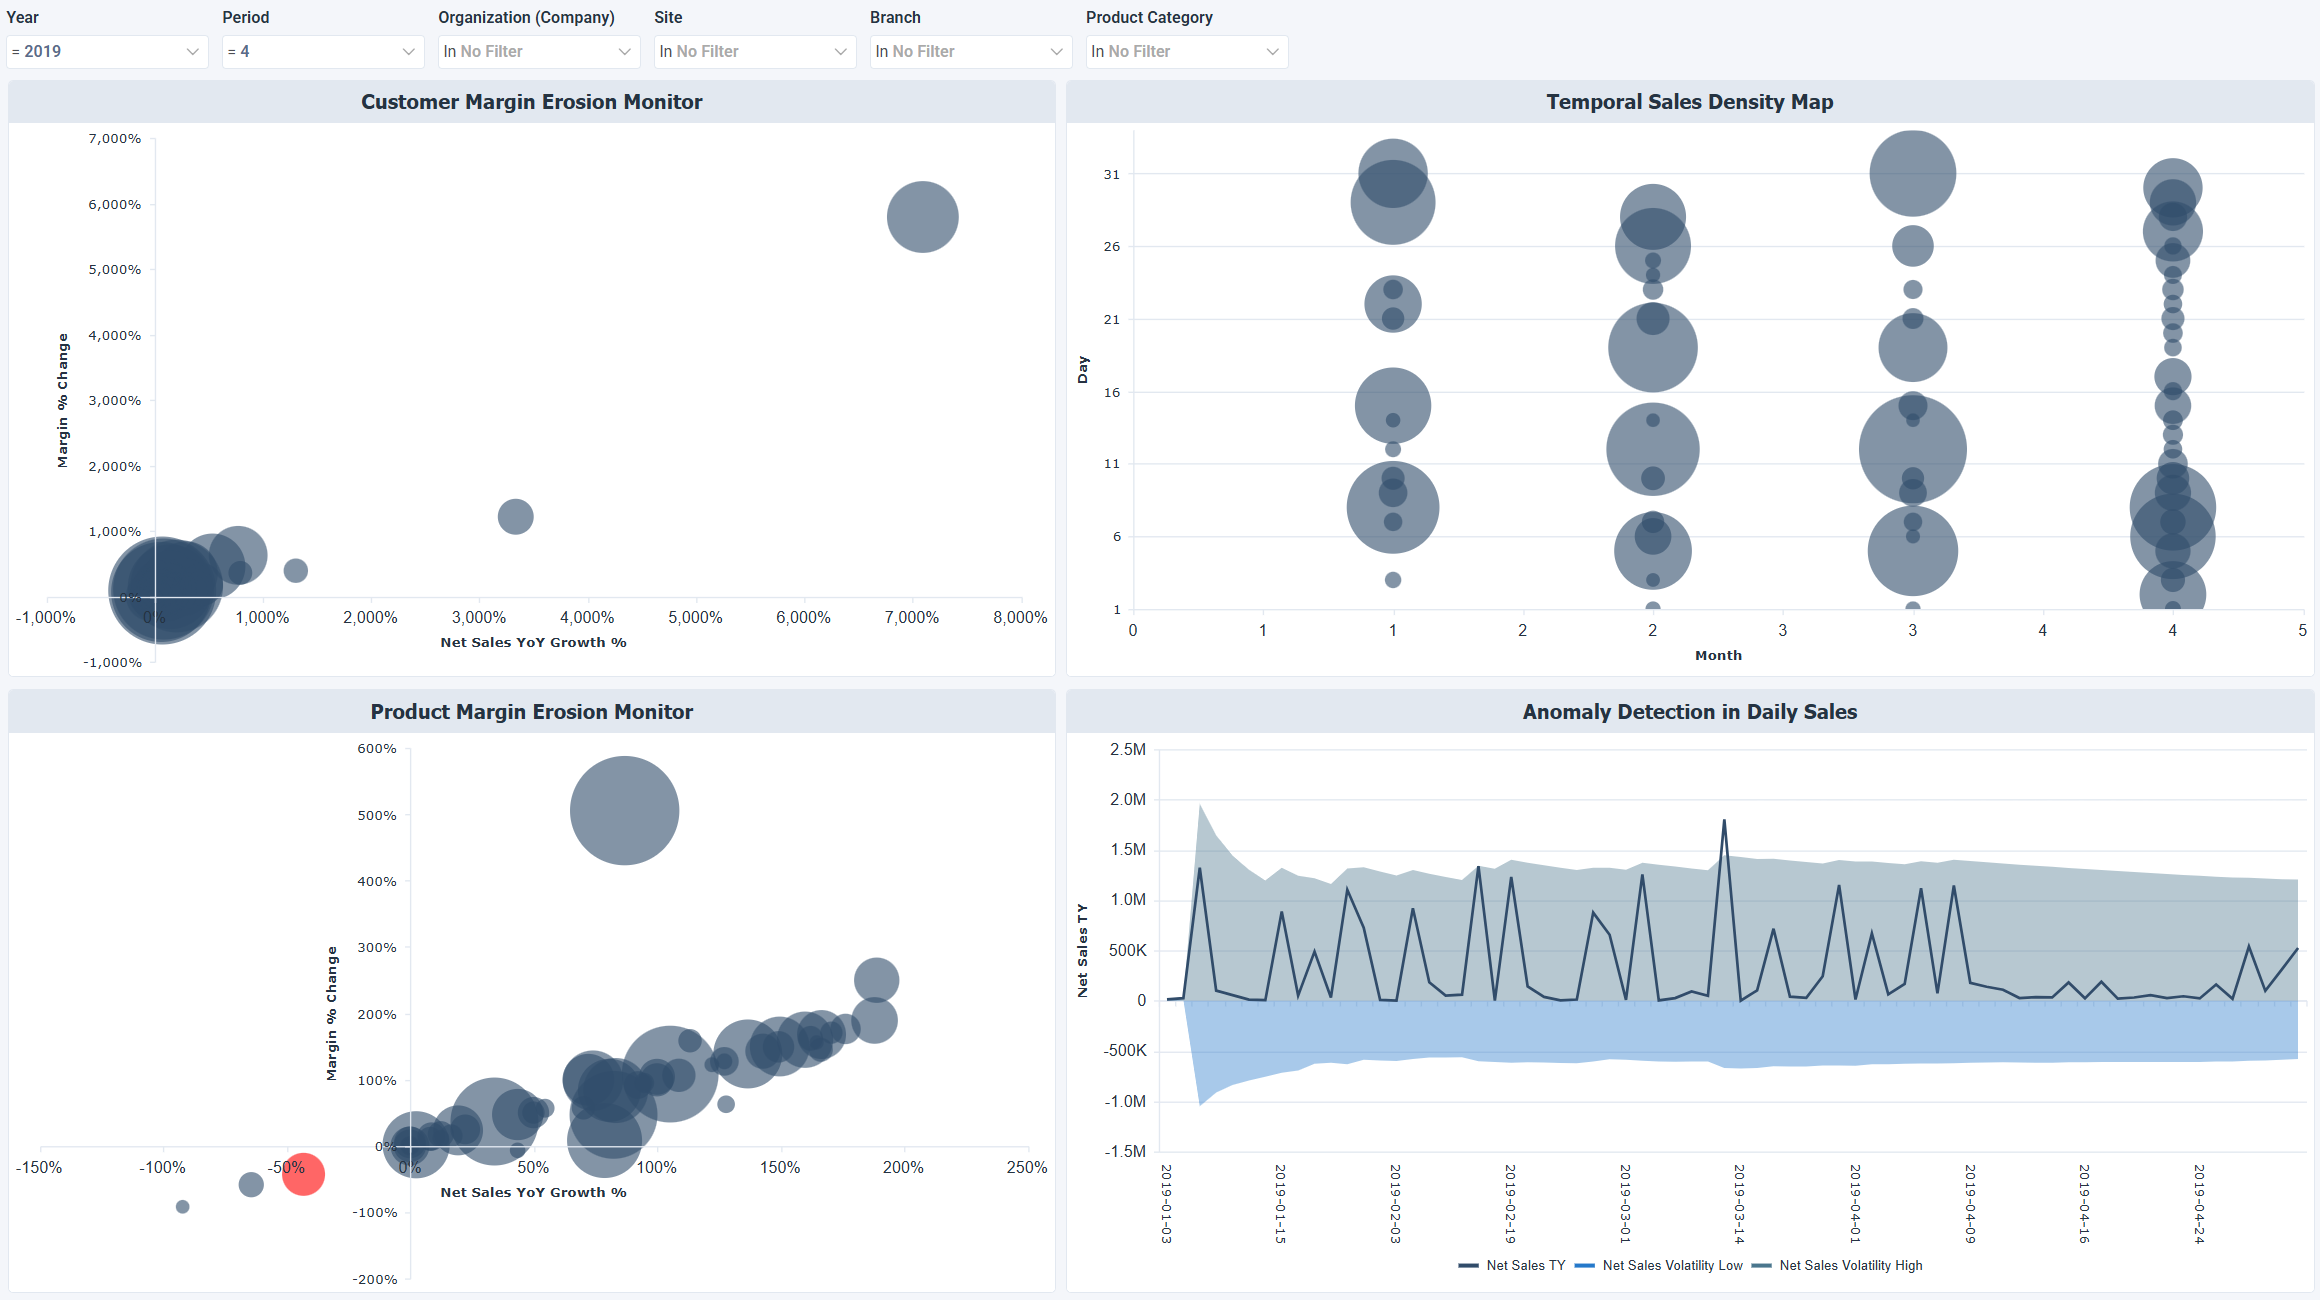
The Sales Anomalies and Trends dashboard for Acumatica detects margin erosion, unusual daily sales activity, and sales concentration by period. It helps identify customers and products where margins are declining, periods with unusually high or low sales density, and daily sales that fall outside expected ranges.
How to use the sales anomalies and trends dashboard
- Identify margin risks early to catch customer and product margin erosion before the financial impact grows.
- Flag unusual sales spikes or drops to investigate potential errors, timing issues, or one-off events.
- Reveal sales density patterns to see when sales activity is most concentrated by day or period.
- Protect customer and product profitability by isolating which accounts or products are driving margin erosion.
- Surface outliers in daily sales by comparing actual net sales against expected volatility bands.
Filters
Use the filtering panel at the top of the Sales Anomalies and Trends dashboard to control which data is shown. The filters apply to all views and ensure the dashboard reflects the selections you choose.
Year: one value
Period: one value
Organization: multiple values
Site: multiple values
Branch: multiple values
Product Category: multiple values
Visual components
| View name | Type of view | What it shows |
|---|---|---|
| Customer Margin Erosion Monitor | Bubble | Plots customers by net sales variance %, with bubble size reflecting sales volume. Customers further right show stronger variance, and those with shrinking margins cluster toward the bottom. |
| Temporal Sales Density Map | Bubble | Plots sales activity by calendar period, with bubble size reflecting sales volume, larger bubbles for periods with a higher concentration of sales. |
| Product Margin Erosion Monitor | Bubble | Plots products by net sales variance %, with bubble size reflecting sales volume, using the same structure as the customer view at the product level. |
| Anomaly Detection in Daily Sales | Combination | Plots daily net sales alongside high and low volatility bands, flagging days where sales fall outside the expected range for investigation. |