Product Sales & Geographic Performance
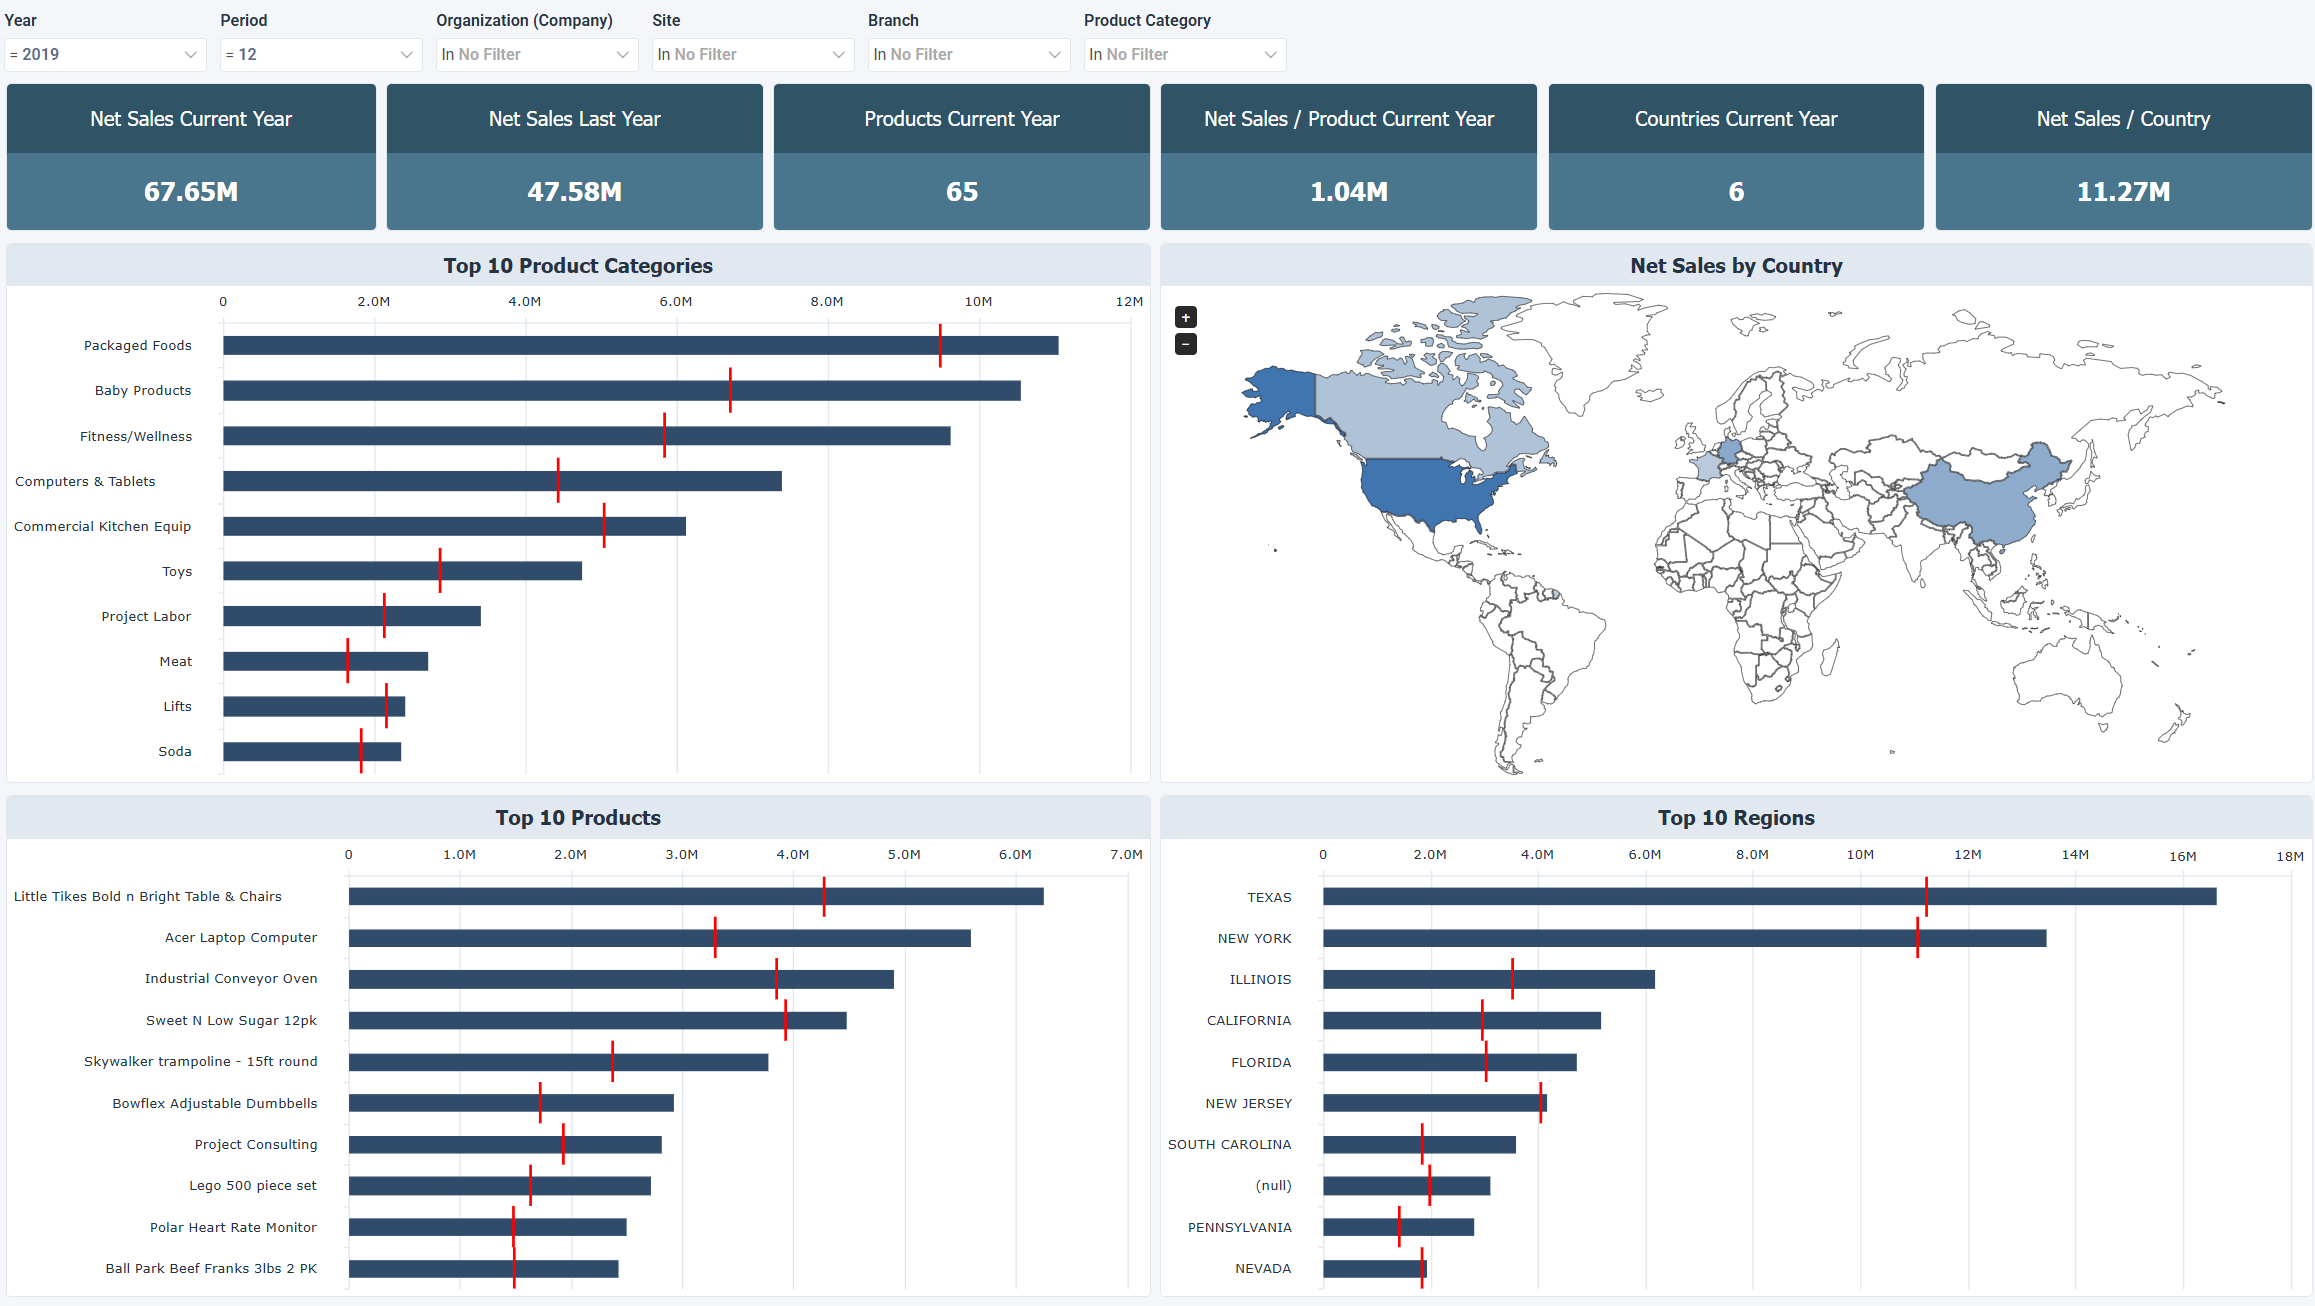
The Product Sales & Geographic Performance dashboard for Acumatica combines sales performance by product, category, country, and region. It shows which product lines, individual products, countries, and regions generate the most net sales, along with per product and per country averages.
How to use the product sales and geographic performance dashboard
- Spot top and underperforming products to guide assortment, pricing, and lifecycle decisions.
- Track geographic revenue distribution to see where international sales are concentrated.
- Flag revenue concentration risk where sales depend heavily on specific products, categories, or regions.
- Compare product and country averages to see how efficiently the portfolio and footprint convert into revenue.
Filters
Use the filtering panel at the top of the Product Sales & Geographic Performance dashboard to control which data is shown. The filters apply to all views and ensure the dashboard reflects the selections you choose.
Year: one value
Period: one value
Organization: multiple values
Site: multiple values
Branch: multiple values
Product Category: multiple values
Key performance indicators (KPIs)
The key performance indicators (KPIs) at the top of the dashboard show current year counts and averages for products and countries, and update based on the filters you apply.
| KPI | What it measures |
|---|---|
| Net Sales Current Year | Total recognized sales revenue for the selected fiscal period in the current year. |
| Net Sales Last Year | Total recognized sales revenue for the equivalent fiscal period in the prior year, used as a baseline for year over year comparison by product and geography. |
| Products Current Year | Number of distinct products generating sales in the current fiscal period, higher for broader product activity and lower when sales are concentrated in fewer products. |
| Net Sales / Product Current Year | Average revenue generated per active product, higher when products generate more revenue individually. |
| Countries Current Year | Number of distinct countries generating sales in the current fiscal period, higher for broader international presence and lower when sales are concentrated geographically. |
| Net Sales / Country | Average revenue generated per active country, higher for deeper penetration in fewer countries and lower when revenue is spread more thinly. |
Visual components
| View name | Type of view | What it shows |
|---|---|---|
| Top 10 Product Categories | Horizontal Bullet | Ranks the top 10 product categories by net sales TY, with last year as a reference line to show year over year change. |
| Net Sales by Country | Map | Shows net sales distributed across a world map, with shading reflecting sales volume by country. |
| Top 10 Products | Horizontal Bullet | Ranks the top 10 individual products by net sales TY, with last year as a reference line. |
| Top 10 Regions | Horizontal Bullet | Ranks the top 10 regions by net sales TY, showing where revenue is geographically concentrated. |