Frequency, Top Performers, and Trends
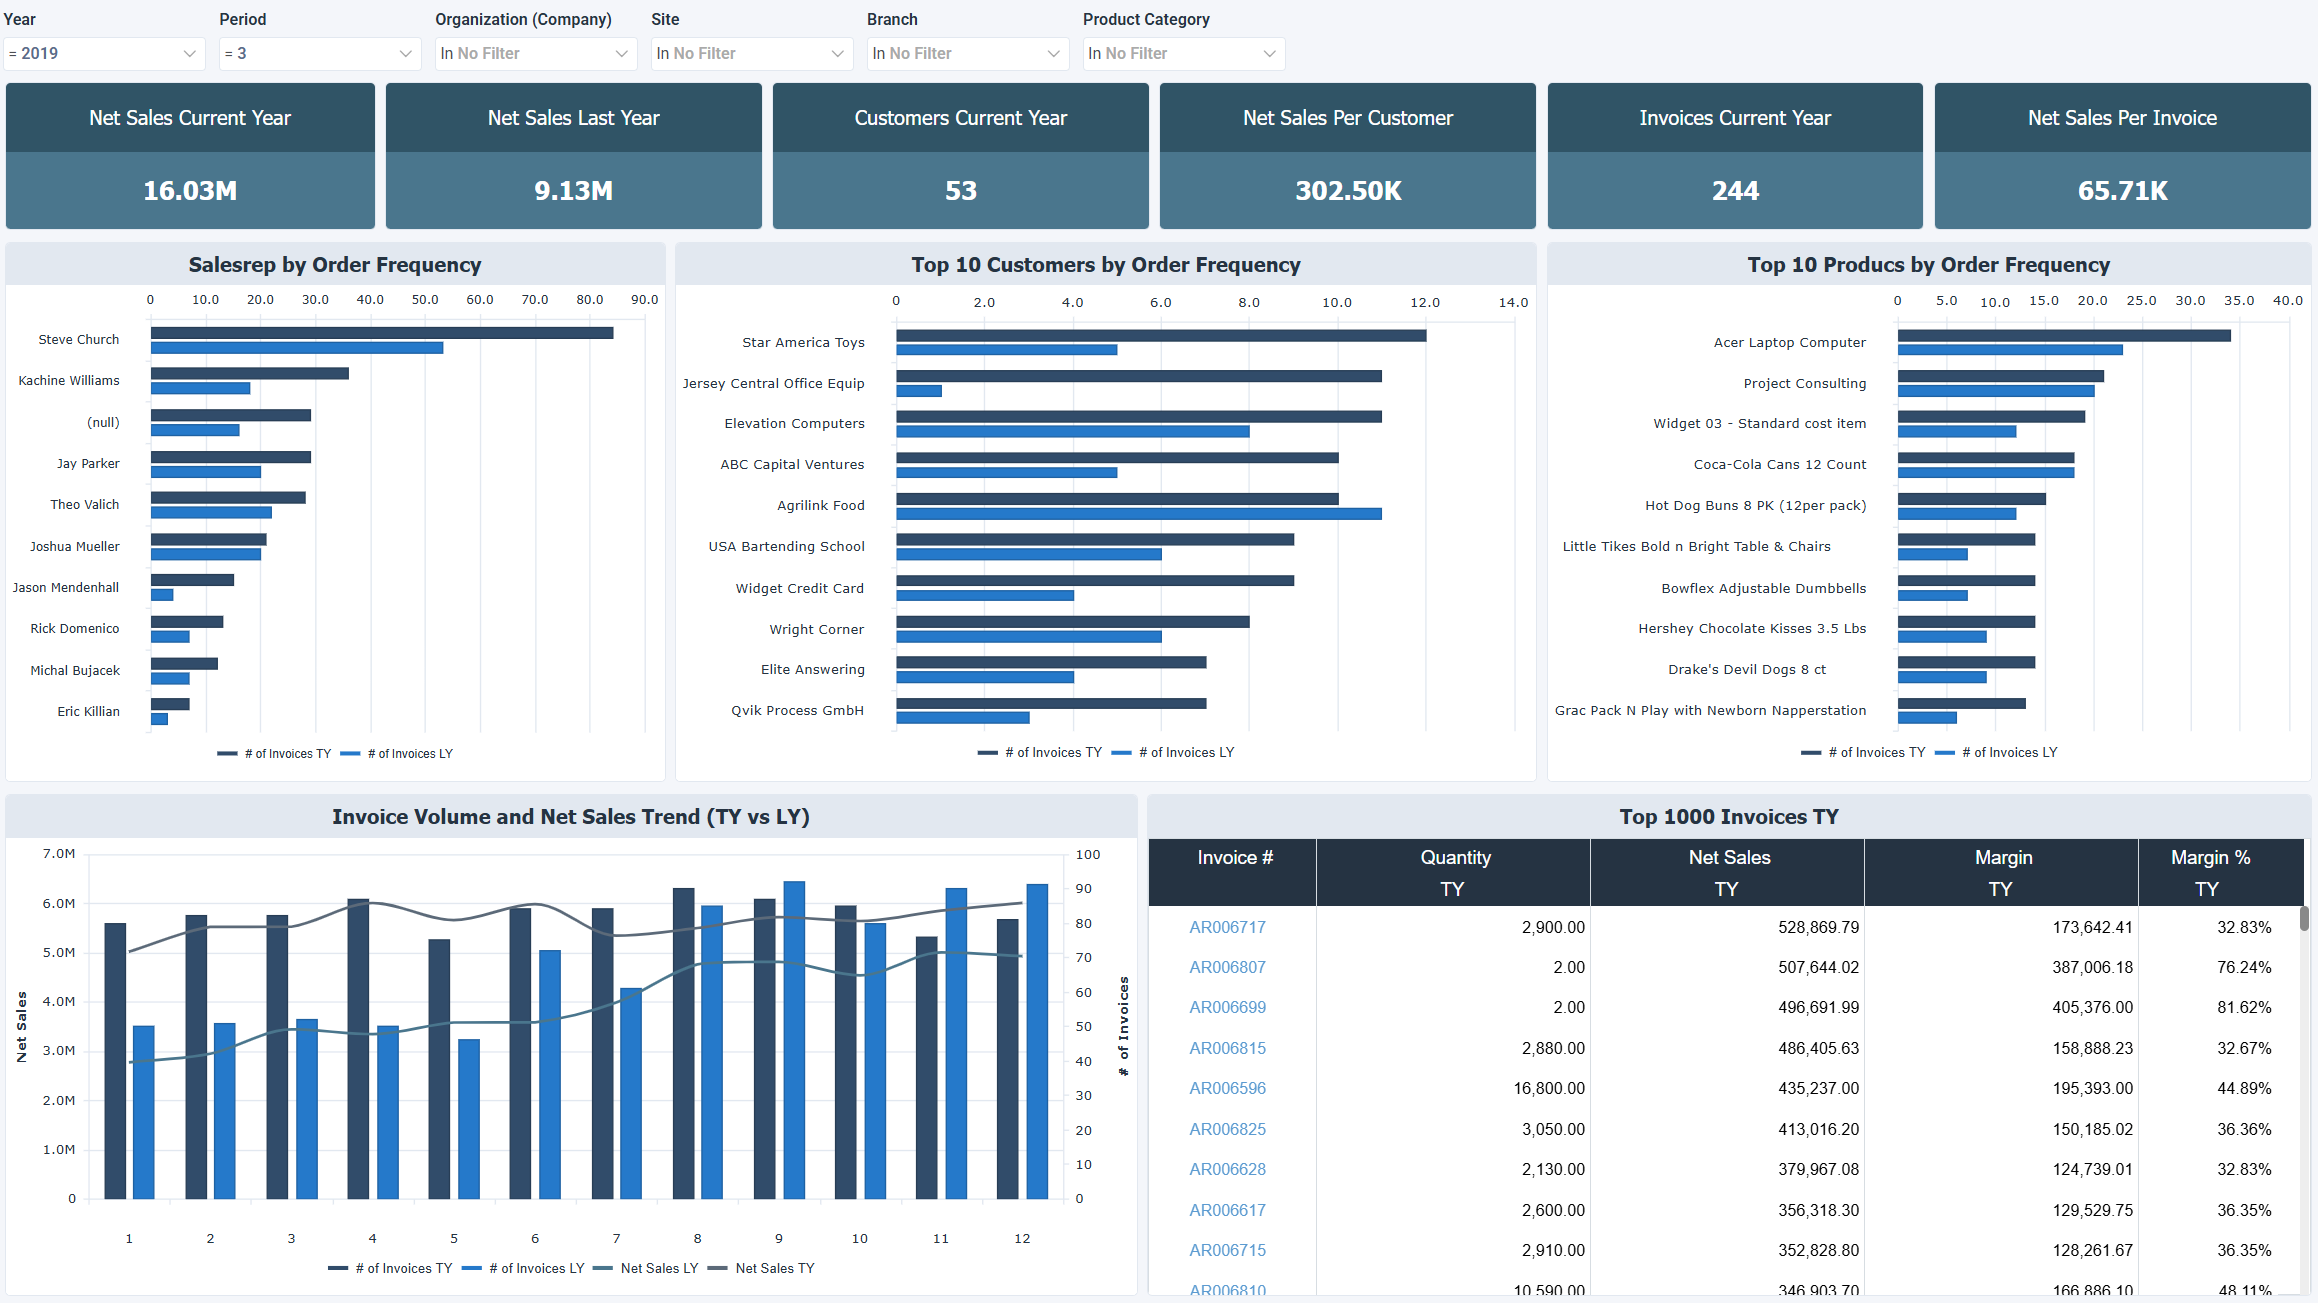
The Frequency, Top Performers, and Trends dashboard for Acumatica tracks sales activity frequency, commercial concentration, and transaction efficiency across sales reps, customers, products, and invoices. It shows how often orders are placed, how many customers and invoices are active, and what the average net sales per customer and per invoice look like.
How to use the frequency, top performers and trends dashboard
- Assess revenue productivity by seeing how effectively customers and invoices convert into net sales.
- Identify top performers among sales reps, customers, and products by order frequency.
- Track transaction efficiency using average invoice value and revenue per customer.
- Spot commercial concentration risk where sales depend heavily on a small number of high frequency customers, products, or reps.
Filters
Use the filtering panel at the top of the Frequency, Top Performers, and Trends dashboard to control which data is shown. The filters apply to all views and ensure the dashboard reflects the selections you choose.
Key performance indicators (KPIs)
The key performance indicators (KPIs) at the top of the dashboard show current year totals and per unit averages for sales and order activity, and update based on the filters you apply.
| KPI | What it measures |
|---|---|
| Net Sales Current Year | Total recognized sales revenue for the selected fiscal period in the current year. |
| Net Sales Last Year | Total recognized sales revenue for the equivalent fiscal period in the prior year, used as a baseline for year over year comparison. |
| Customers Current Year | Number of distinct customers generating sales in the selected fiscal period, higher for a broader customer base and lower when sales are more concentrated. |
| Net Sales Per Customer | Average revenue per active customer in the current year, higher when customers generate more revenue individually. |
| Invoices Current Year | Number of sales invoices issued in the current fiscal period. |
| Net Sales Per Invoice | Average revenue per invoice issued in the current year, higher for larger average deal sizes and lower for smaller, more frequent transactions. |
Visual components
| View name | Type of view | What it shows |
|---|---|---|
| Salesrep by Order Frequency | Horizontal Bar | Ranks sales reps by number of invoices TY and LY, showing who generates the most order activity and how it changed year over year. |
| Top 10 Customers by Order Frequency | Horizontal Bar | Ranks the top 10 customers by number of invoices TY and LY, showing which accounts place orders most frequently. |
| Top 10 Products by Order Frequency | Horizontal Bar | Ranks the top 10 products by number of invoices TY and LY, showing which products appear on the most orders. |
| Invoice Volume and Net Sales Trend | Combination | Plots net sales TY and LY alongside invoice count TY and LY by period, showing how revenue and order volume trend together over time. |
| Top 1000 Invoices TY | Worksheet | Lists the top 1000 current year invoices with quantity, net sales, margin, and margin % for detailed analysis. |