AI Management Dashboard
The AI Management page is a dashboard made up of KPIs and charts to monitor, analyze, and manage how Nectari Copilot is used across users. It shows data in real time for the past 12 months, so you can review overall and per user credit consumption. You can also identify which Nectari Copilot features are used most.
Your license comes with a base amount of credits, shared by all users on that license. If credits run low and you need more, you can subscribe to additional credits at any time. From there, you can manage how credits are used and set a limit for specific users from the User Management tab.
Reviewing AI usage applies to the license model introduced in 2026.
When to monitor AI usage
- Track credit usage across the license and for each user, for budgeting and oversight.
- Set credit limits for each user to prevent overuse.
- See which users and features use the most credits, to guide future decisions.
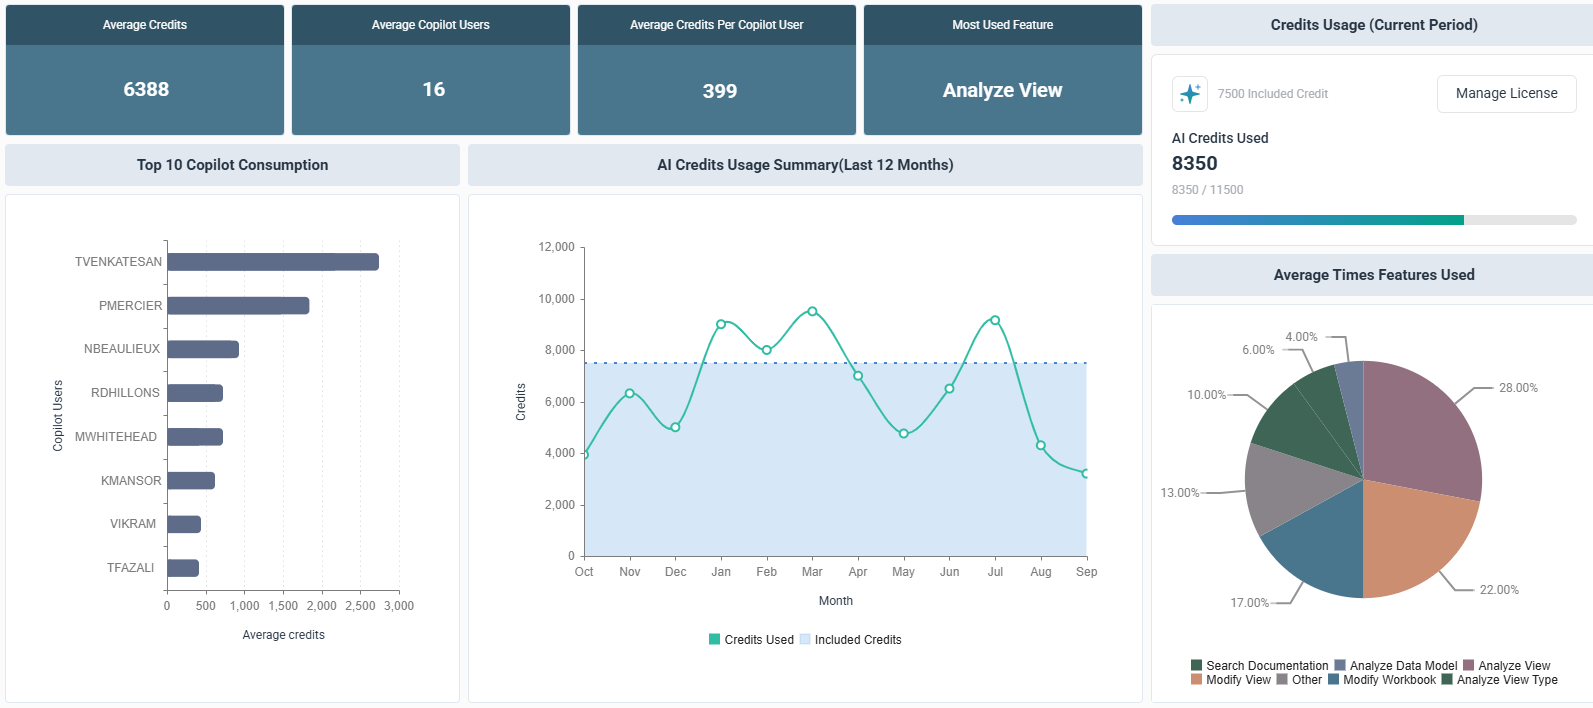
Key performance indicators (KPIs)
The four KPIs below summarize AI credit consumption and Nectari Copilot usage over the last 12 months, giving a quick overview before the detailed charts beneath.

- Average Credits reports the average AI credits consumed.
- Average Copilot Users reflects the average number of unique users who accessed Nectari Copilot.
- Average Credit Per Copilot User indicates the average credits used per active Nectari Copilot user.
- Most Used Feature names the Nectari Copilot feature with the most activity.
Review the top 10 Copilot consumption
The Top 10 Copilot Consumption chart ranks the users with the highest average Nectari Copilot usage over the last 12 months, from highest to lowest. Since AI credits are shared across your entire license, you can view exactly which user uses the most credits and how their usage compares to the rest of the team. If a user's average usage looks high, you can review their activity and set a credit limit for that user to keep their usage within a defined range.
Hovering over any bar shows the exact number of credits that user used over the same 12-month period.
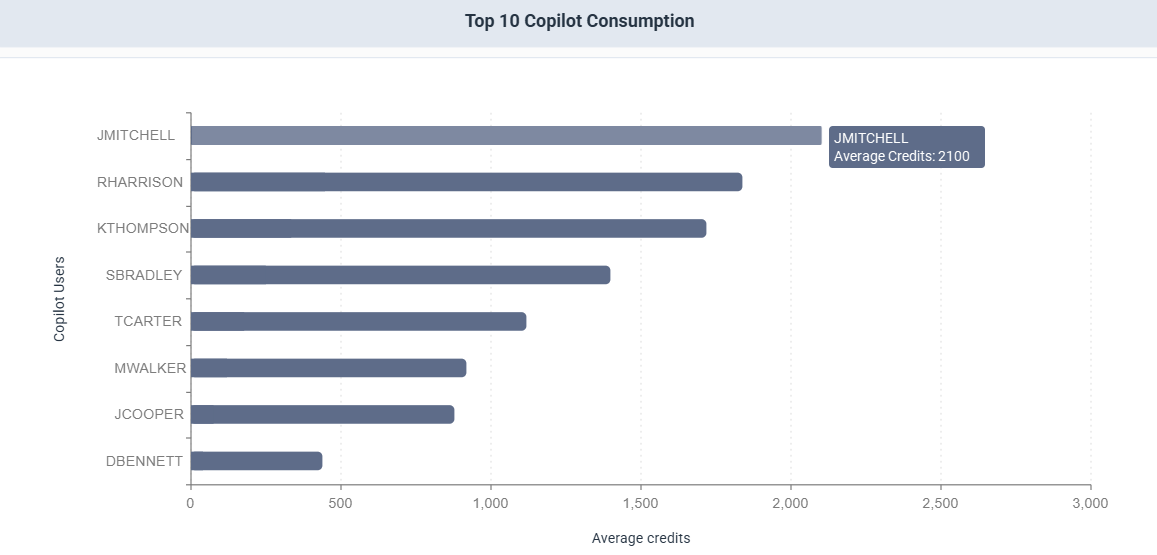
On this chart, the user JMITCHELL averages just over 2,000 credits, nearly five times the usage of the user DBENNETT who is at the bottom of the list.
See the credits usage from the past 12 months
The AI Credits Usage Summary (Last 12 Months) chart plots credits used each month against the base amount included with your license. The shaded blue area marks that included amount. When the green line rises above it, usage goes over the included credits for that month, and any additional credits you subscribed to cover the difference. Meanwhile, when the line stays inside the shaded area, usage fits within the included amount.
Hovering over a specific month shows the exact number of credits used that month.
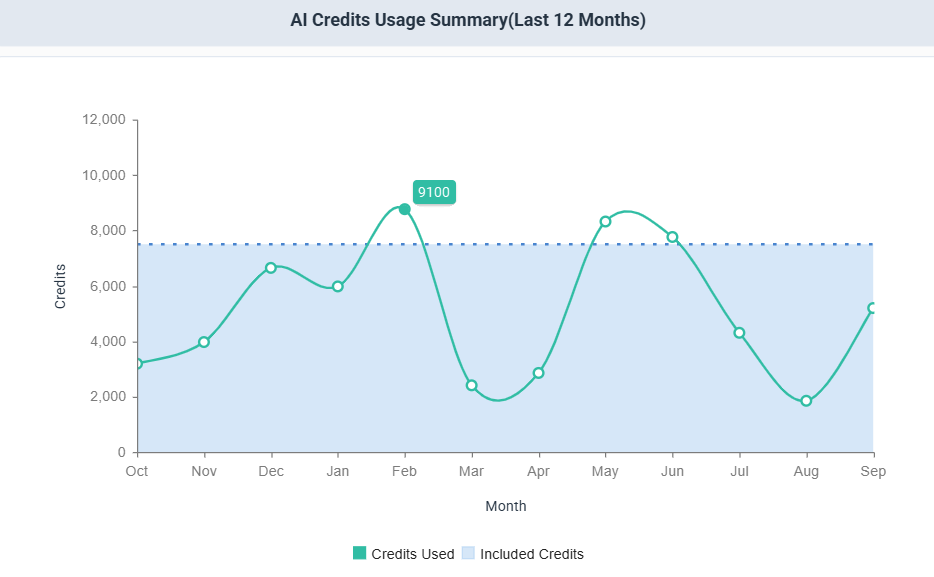
On this chart, credit usage varies from month to month. February has the highest usage at 9,100 credits, while August has the lowest at 2,100 credits. Usage averages 5,817 credits per month across the full period.
Break down Nectari Copilot usage by feature
The Average Times Features Used pie chart shows the proportion of Nectari Copilot activity by feature. Every prompt and conversation is automatically categorized into one of the features listed below, so the chart reflects how Nectari Copilot is actually being used, whether that's mostly answering documentation questions, analyzing data, or modifying workbooks and views.
This chart pairs with the Most Used Feature KPI card above it, which names the largest slice shown here. Also, clicking any item in the legend temporarily hides that slice, making it easier to compare the remaining features on their own.
This chart is only available with the Professional license.
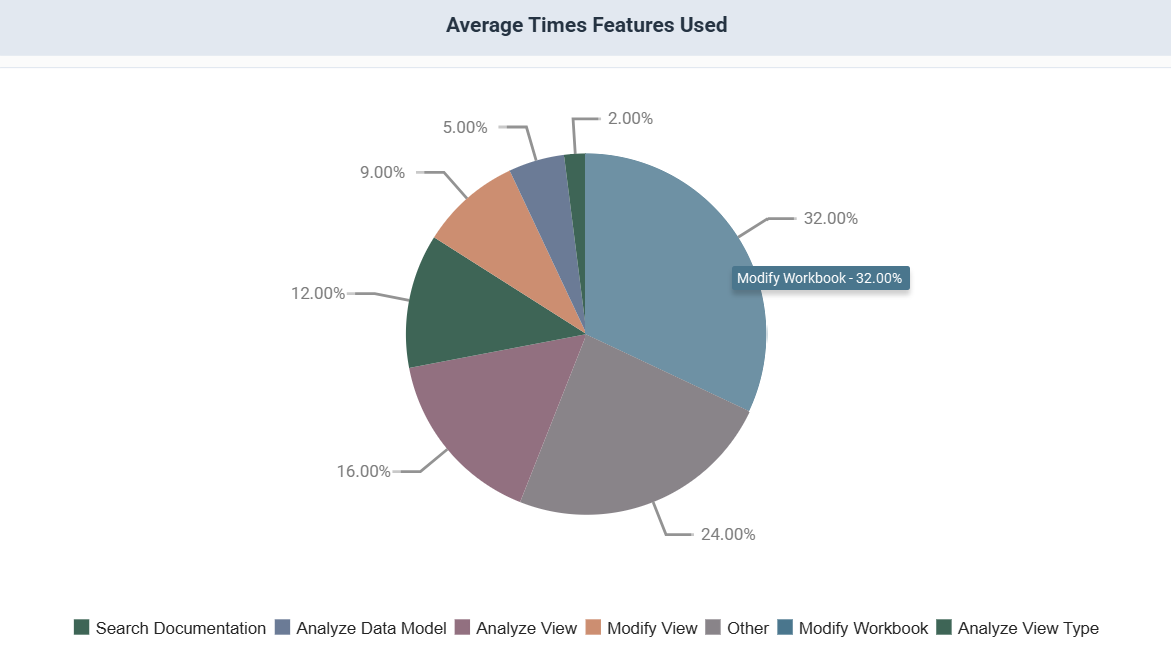
On this chart, the Modify Workbook feature is the largest category with 32% of all activity, making up close to a third of all Nectari Copilot activity on its own.
Nectari Copilot features
| Feature | What it covers | Example prompt |
|---|---|---|
 Search Documentation Search Documentation | Inquiries about using specific features in SEI. | How can I filter a dashboard? |
 Analyze Data Model Analyze Data Model | Questions about the current data model. | What columns are in my data model? |
 Analyze View Analyze View | Questions about the current view. | Who is my top customer? |
 Modify View Modify View | Requests to change view properties or layout. | Modify the look of my legend. |
 Other Other | Failed or unrecognized questions. | Broken or unsupported requests. |
 Modify Workbook Modify Workbook | Requests to change or generate workbook content. | Give a summary of this sheet. |
 Analyze View Type Analyze View Type | Questions about which view or chart type to use. | Should I use a bar chart or vector map? |